2 Results and Discussion
2.1 Analysis of Residues Nearby Each Heme Molecule
We began the study by acquiring data to elucidate and quantify the propensity of amino acids to interact with heme (HEM, HEC, SRM, VEA/VER) in its binding environment. This study focused on potential interactions with the entire heme molecule, including the porphyrin ring and attached groups; therefore, any amino acids with potential interactons with the heme iron, porphyrin ring, or groups on the porphyrin ring (e.g. vinyl, propionate groups), were included in the data gathered for this section. A potentially interacting amino acid was therefore defined as any amino acid with at least one atom within the distance cutoffs (5 and 7 Angstroms (A)) from the heme molecule.
Amino acid frequencies were obtained for residues within the distance cutoffs of 5A and 7A - these data are overlaid in several figures in Appendix A.1. The trends in these data are very similar and therefore only the data pertaining to the 7A distance cutoff are discussed below.
2.1.1 Heme-b
2.1.1.1 Amino Acid Frequencies in Binding Pocket
Figure 2.1 plots the frequency of each residue within 7A of heme-b.
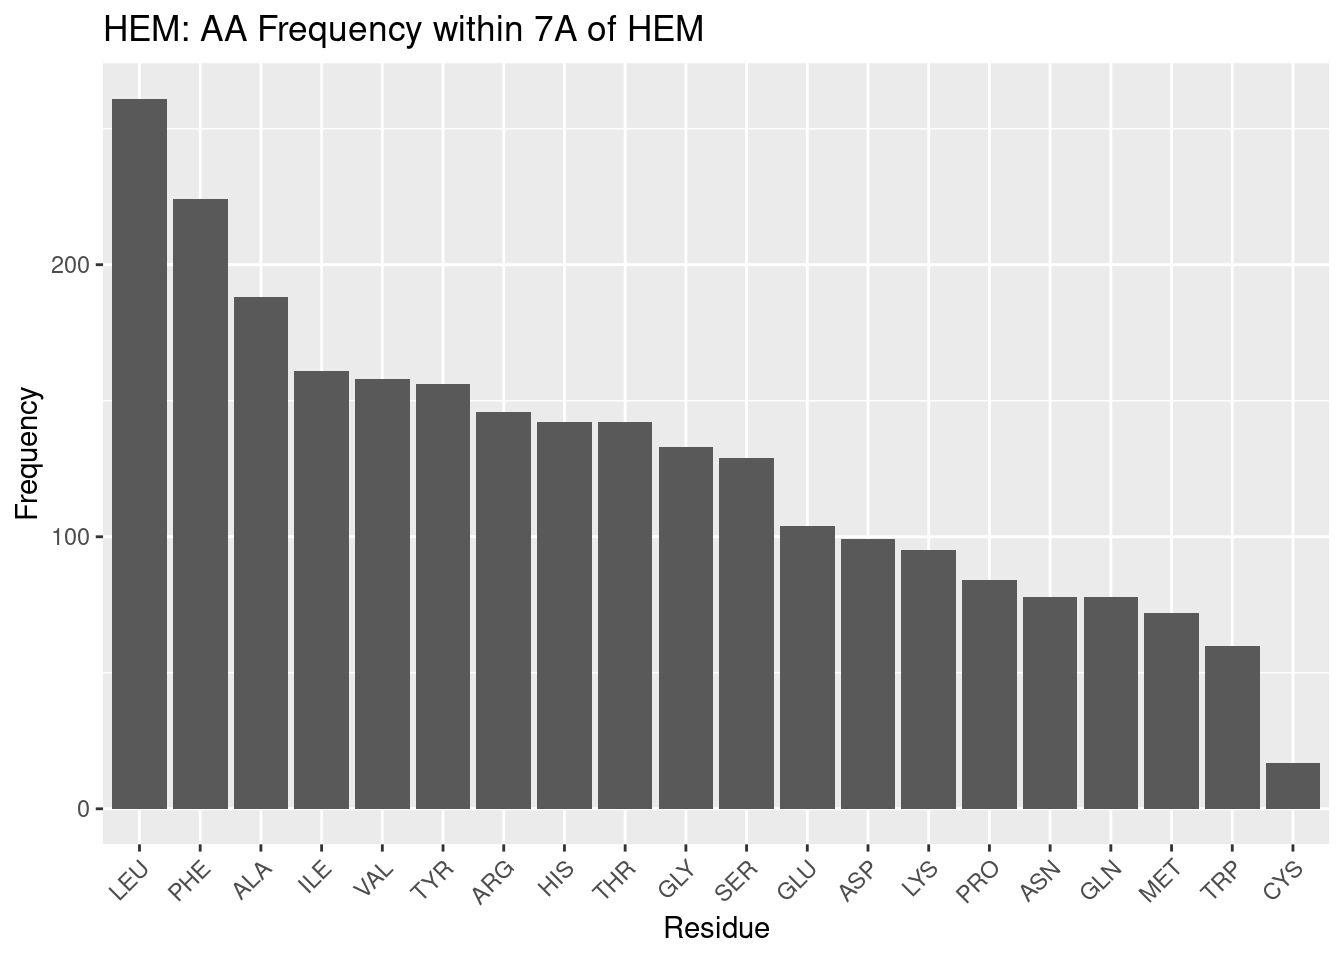
Figure 2.1: HEM: AA Frequency within 7A
| Residue | Freq |
|---|---|
| LEU | 261 |
| PHE | 224 |
| ALA | 188 |
| ILE | 161 |
| VAL | 158 |
| TYR | 156 |
| ARG | 146 |
| HIS | 142 |
| THR | 142 |
| GLY | 133 |
| SER | 129 |
| GLU | 104 |
| ASP | 99 |
| LYS | 95 |
| PRO | 84 |
| ASN | 78 |
| GLN | 78 |
| MET | 72 |
| TRP | 60 |
| CYS | 17 |
Beginning at the left of Figure 2.1 and moving right, large, nonpolar amino acids appear most frequently within 7A: LEU and PHE; ILE appears less frequently than these two amino acids but nonetheless is in high frequency. Small, nonpolar amino acids ALA and VAL also appear very frequently. As the majority of the heme-b molecule is made up of the nonpolar porphyrin ring, these amino acids are therefore likely in such high frequency to provide the nonpolar interactions with the pyrole groups and methyl and vinyl groups.
Tyrosine, arginine, histidine appear next most frequently. The two propionate groups on heme make polar interactions with salt bridges formed between arginine groups within the binding environment(Barrows and Poulos 2005). Therefore, the tyrosine and histidine likely form polar interactions with the portion of the propionate groups not interacting with the arginine salt bridges. This, in addition to the nonpolar interactions above, likely provides as hospitable of a binding environment as possible to coordinate the heme. It should be noted histidine is one of the residues that coordinates the iron atom, and this may therefore increase its frequency in the binding pocket.
Glycine is a small residue and cannot form significant interactions within its environment; however, its frequency, or lack thereof (compared to background frequency, discussed below), suggests the binding pocket may not require as much flexibility or spatial considerations as in the rest of the protein.
Next appear serine, glutamate (glutamic acid) and aspartate (aspartic acid) and lysine. These are polar residues, and glutamate and aspartate are negatively charged; lysine is polar too, but positively charged (at pH 7). The negative charge on glutamate and aspartate may explain why they are fairly infrequent: although polar, the negative charge may induce a repulsion effect with the propionate groups. Or, it may be that other amino acids are preferable, as is likely the case for lysine. Lysine is polar and positively charged; but arginine residues forms the salt bridges necessary for propionate to make polar interactions. And histidine coordinates the heme iron. Therefore the infrequency of lysine may be less due to a problem with lysine and more due to a preference for other polar amino acids.
Proline is a small nonpolar amino acid in low frequency; the trend for heme-b, at least, appears to be to favor large nonpolar amino acids in the binding pocket. This may suggest that a large amount of nonpolar interactions, per residue, is favored in the binding pocket, perhaps because of the limited space available to position residues to interact with heme.
Asparagine and glutamine are both medium-sized polar amino acids; given the trends already discussed it is surprising these are not in greater abundance. But as with proline, it may simply be a matter of maximizing the benefit of the interactions that may be formed with the heme; while asparagine and glutamine are polar, amino acids like arginine and histidine are both polar and positively charged (and arginine forms salt bridges), capable of stronger interactions with the electronegative propionate groups.
Methionine and tryptophan appear very infrequently in the binding pocket. Tryptophan is very surprising to find as second-to-least frequent. It is a large nonpolar amino acid - but perhaps its single, potential hydrogen bond, although weak, is enough to prefer completely nonpolar residues. Or, with its size, it is preferable to have more numerous, smaller nonpolar residues that can favorably interact with the porphyrin while reducing steric hindrance of other residues in the environment. The reason for methionine’s low frequency is not clear, perhaps for similar reasons as with proline, where more intensely nonpolar residues are preferred, rather than less nonpolar residues being unfavorable.
Cystine appears most infrequently of all the amino acids in the binding pocket. This is quite surprising - cystine is the other highly conserved residue that may coordinate the heme iron. Perhaps the sample of PDBs used in this study mostly use histidine to coordinate the iron - but this would only account for one residue in the binding pocket per pdb. Therefore these results suggest that while cystidine may be well suited to coordinate the iron in heme, it is poorly suited to form any nonpolar interactions with the porphyrin ring, leaving the task up to other, more suitably, intensely nonpolar amino acids.
Moving away from discussing individual amino acid populations, what is especially notable of the data for heme-b is that nonpolar residues appear in much greater frequency than polar residues. Nonpolar interactions with heme are therefore more numerous than polar interactions. Their multiplicity may also suggest that they are potentially of greater importance than previously thought. At the very least, these results suggest that polar interactions and coordination of the iron atom, while necessary for heme binding, are insufficient, and that nonpolar interactions and the population of nonpolar residues in the binding pocket should be considered when examining the binding environment of heme.
2.1.1.2 Comparison with Background Amino Acid Frequencies
While the frequencies of amino acids in the binding pocket have been discussed, it may also be of interest to compare against the background amino acid frequency, the general frequency of amino acids within the entire monomer. The degree to which any results may affect the significance of the frequencies of the amino acids in the binding pocket is unclear - those amino acids are interacting with the heme. However, an in depth examination of similarities and differences may reveal that some amino acids may simply be extremely highly conserved by chance and by virtue of their numerous population, rather than some chemical benefit.
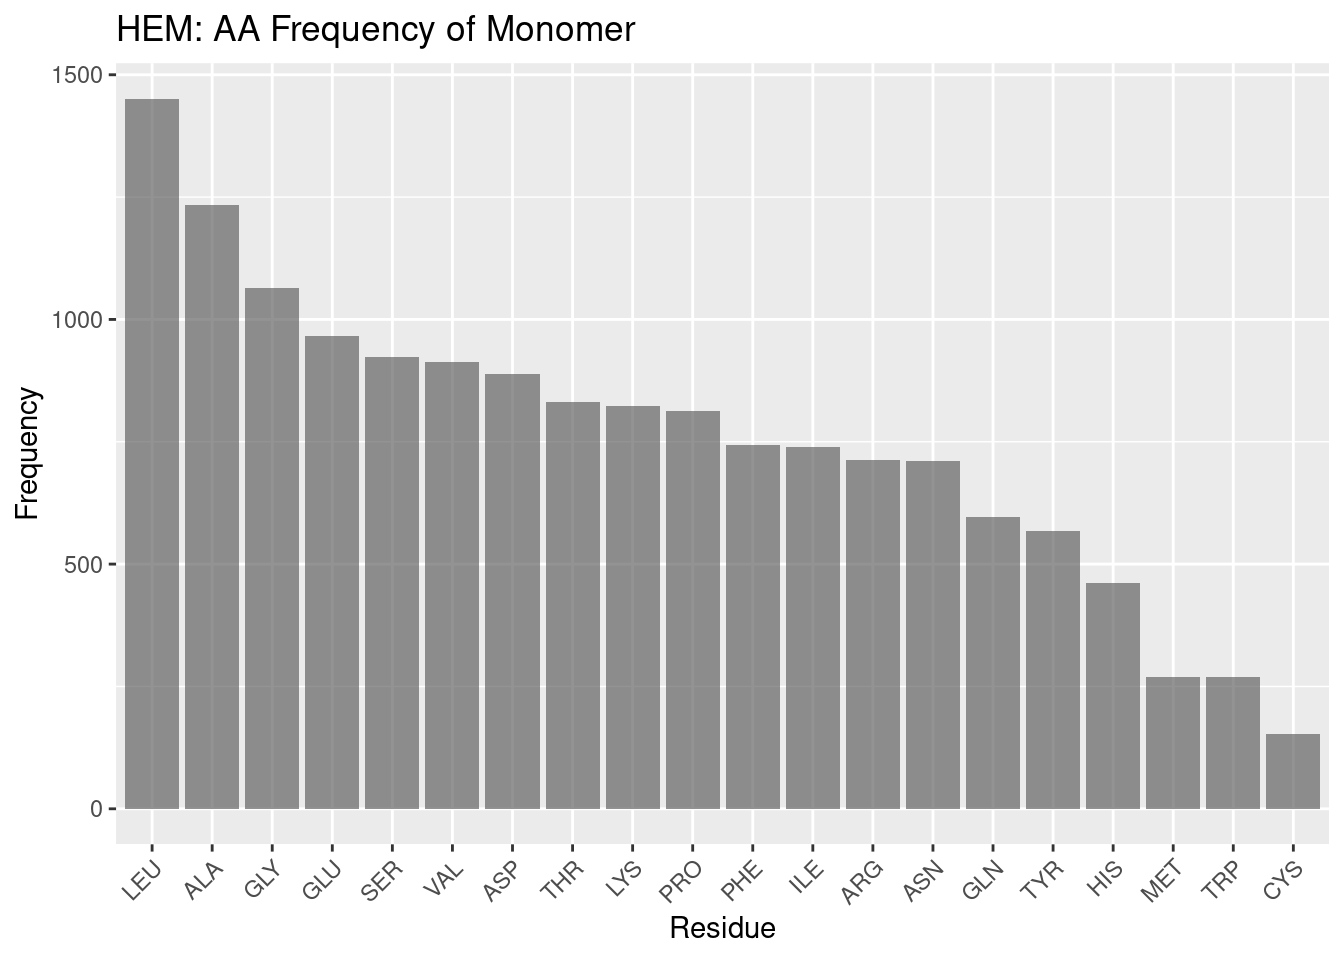
Figure 2.2: HEM: AA Frequency of Monomer
Figure 2.2 documents the frequencies of amino acids overall within the monomer.
Leucine and alanine, as in the binding pocket frequencies, are highly frequent in the overall monomer. This may suggest their prevalence in the binding pocket may simply be due to a high population of leucine and alanine in hemoproteins.
However, after these two amino acids the tendencies in frequency for the binding pocket and the monomer at large diverge. Glycine is in high frequency - likely due to more complex geometry e.g. helices outside the binding pocket. In interest of brevity, the remaining frequencies are summed up thus: the same trends that appear to exist in the binding pocket do not appear to exist in the monomer at large. While the order of frequencies in conserved binding pockets can be rationalized, justifying the overall frequencies in monomers invites significant speculation.
2.1.1.3 Distributon of Amino Acids by Distance
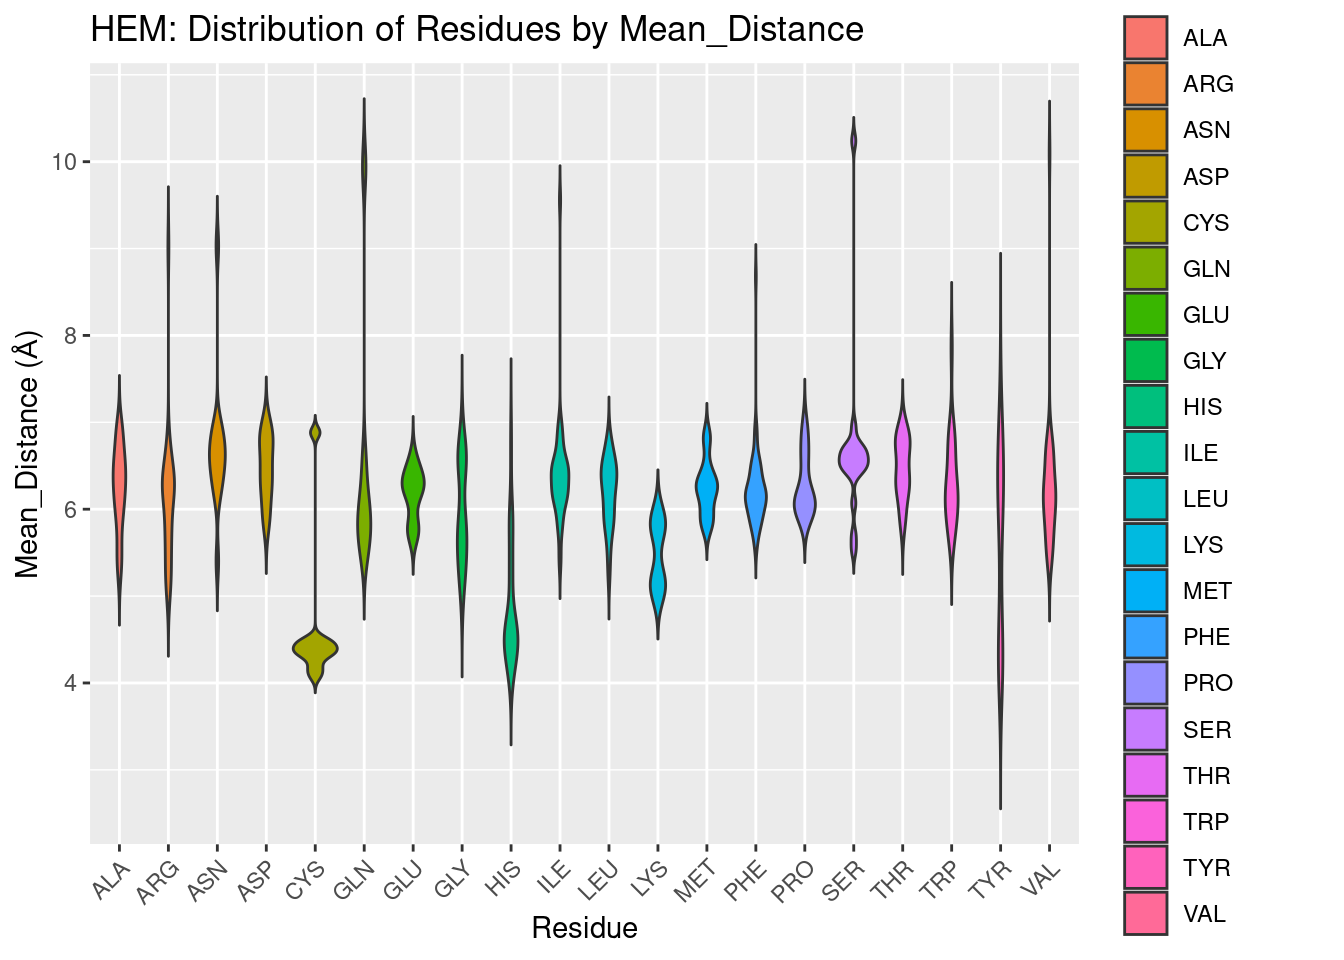
Figure 2.3: HEM: Residue Distribution by Distance
After an exhaustive exploration of the relative frequencies of amino acids in the binding pocket, Figure 2.3 below is fairly straightfoward. It plots the distribution of amino acids in the binding pocket against their distance from the iron of the heme.
We find that only a few residues come in close contact (<4A) of the heme: cysteine, histidine, and tyrosine. Most residues center their distribution at around 6A, although lysine seems more biased than the remaining residues to be a bit closer. Cysteine and histidine may be at least in part explained to be close due to their use as coordinating residues; histidine, being in greater frequency, may also be this close due to favorable interactions with the porphyrin ring.
The proximity of tyrosine however, is more notable. It cannot form coordination bonds with the heme iron, but tyrosine residues do interact with the propionate groups. Tyrosine is also required for redox reactions, and part of the population of tyrosine residues may therefore be in close proximity to heme to facilitate electron transfer in various enzymes (Poulos 2014). These results suggest that of all potentially interacting polar/positively charged residues, tyrosine is the most likely at least to be in close proximity to the heme molecule. Whether this illustrates an importance of tyrosine to interact with propionate groups, or instead the need for tyrosine to be in close proximity in order to form such interactions, or simply demonstrates involvement in oxidation/reduction reactions, is beyond the scope of this study.
2.1.2 Heme-c
2.1.2.1 Amino Acid Frequencies in Binding Pocket
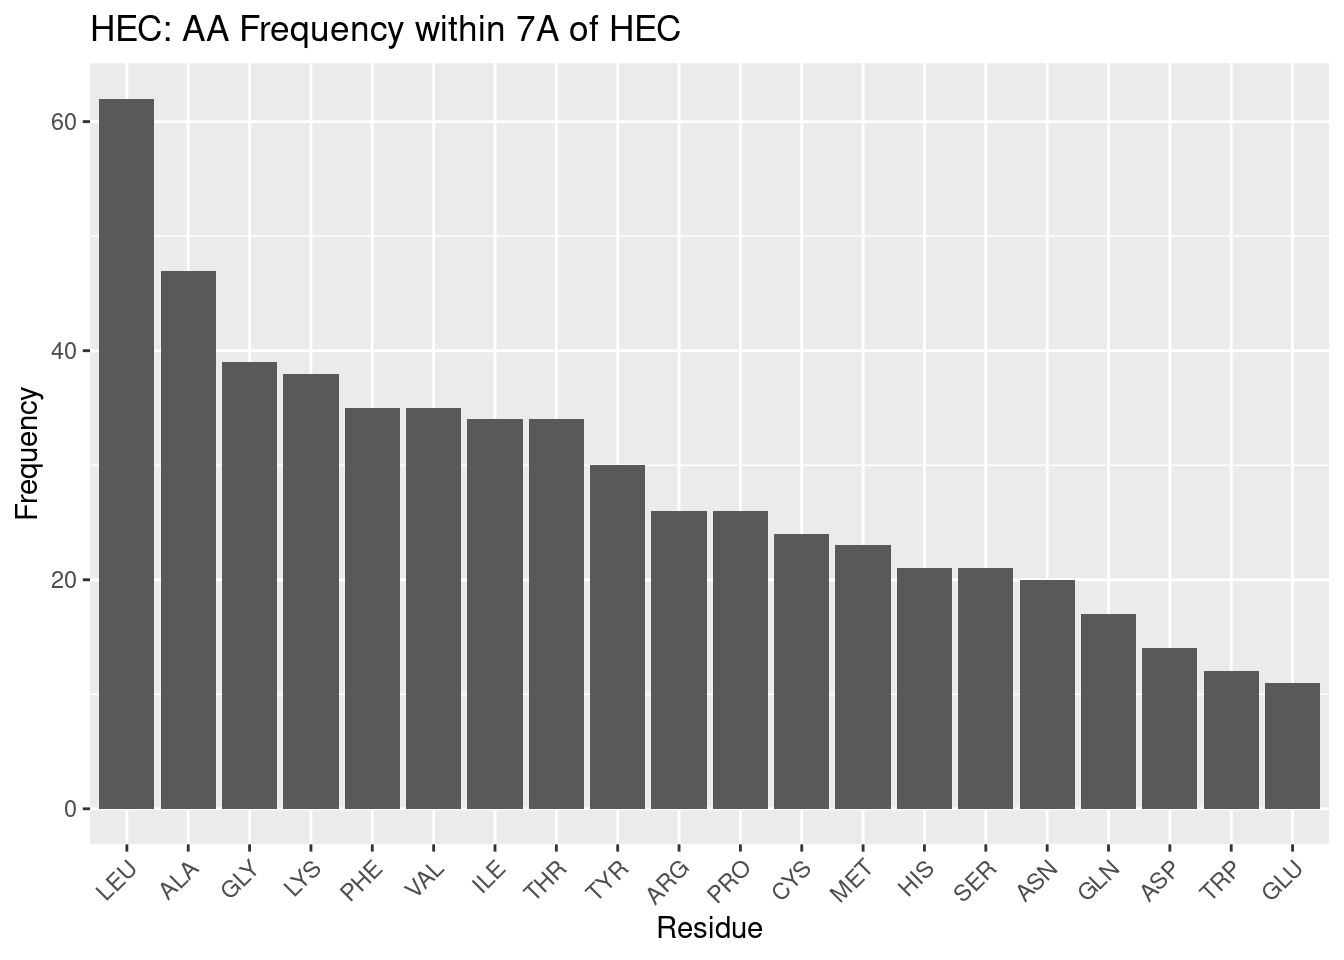
Figure 2.4: HEC: AA Frequency within 7A
Leucine and alanine again are highly frequent for HEC, followed by quite similar trends, and therefore HEC will not be as thoroughly discussed as HEM. The most notable differences may be that GLY and CYS are in far higher frequency than in heme. Heme-c almost always forms covalent bonds with cysteine residues, and this may explain that frequency. But as for the high frequency of glycine, the reason for its abundance is unclear, although it seems it may have an important role in heme-c pockets.
| Residue | Freq |
|---|---|
| LEU | 62 |
| ALA | 47 |
| GLY | 39 |
| LYS | 38 |
| PHE | 35 |
| VAL | 35 |
| ILE | 34 |
| THR | 34 |
| TYR | 30 |
| ARG | 26 |
| PRO | 26 |
| CYS | 24 |
| MET | 23 |
| HIS | 21 |
| SER | 21 |
| ASN | 20 |
| GLN | 17 |
| ASP | 14 |
| TRP | 12 |
| GLU | 11 |
2.1.2.2 Comparison with Background Amino Acid Frequencies
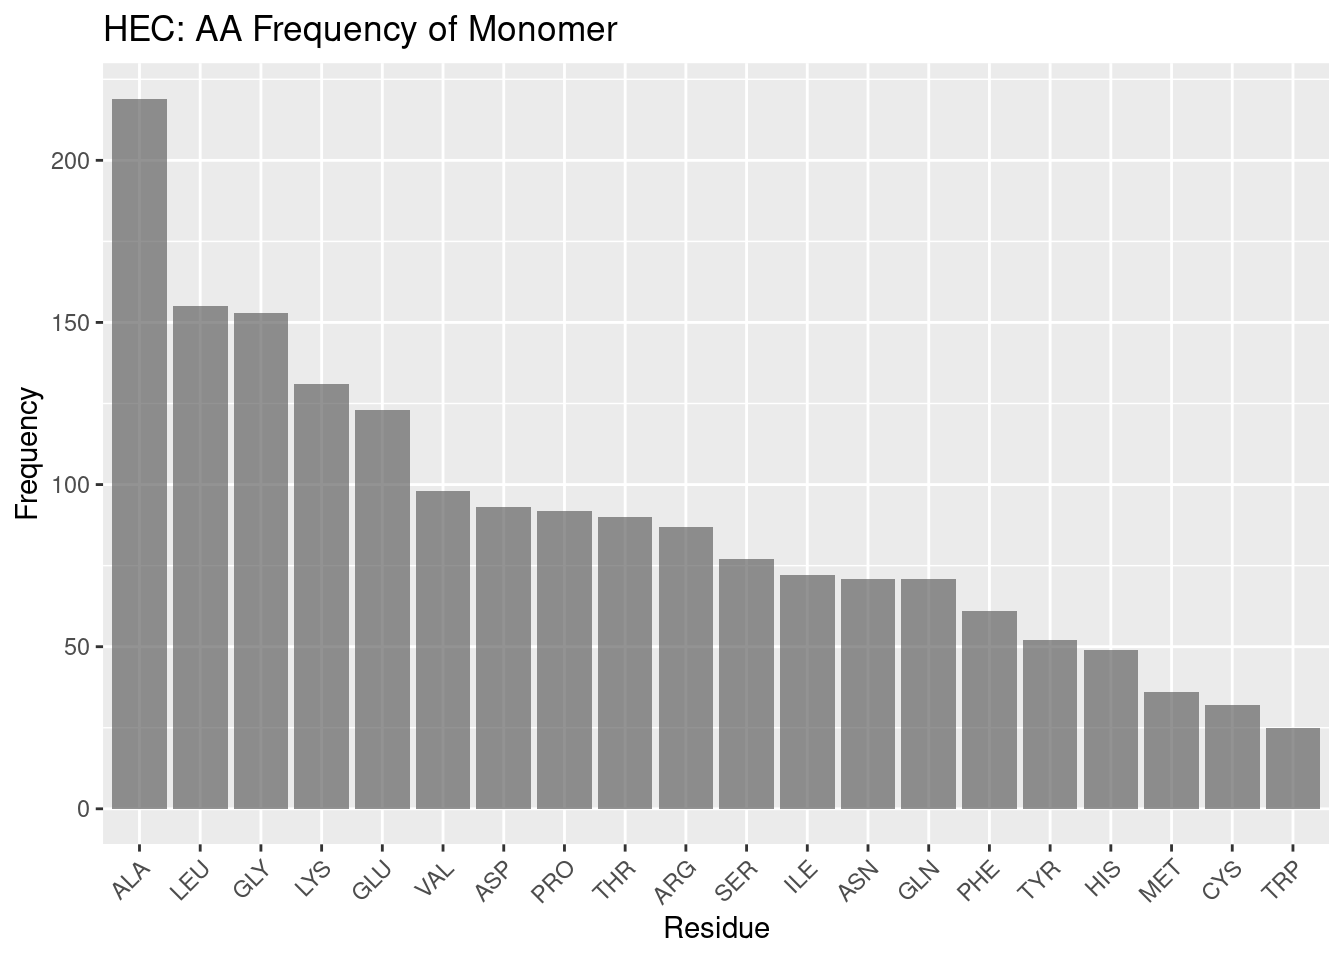
Figure 2.5: HEC: AA Frequency of Monomer
Generally, the heme-c monomer AA frequency profile appears similar to the heme-b monomer, with a high frequency of alanine and leucine, followed by a divergence in the frequency of amino acids and therefore a struggle to form any meaningful discussion when it comes to comparing the binding pocket frequencies against background frequencies.
2.1.2.3 Distributon of Amino Acids by Distance
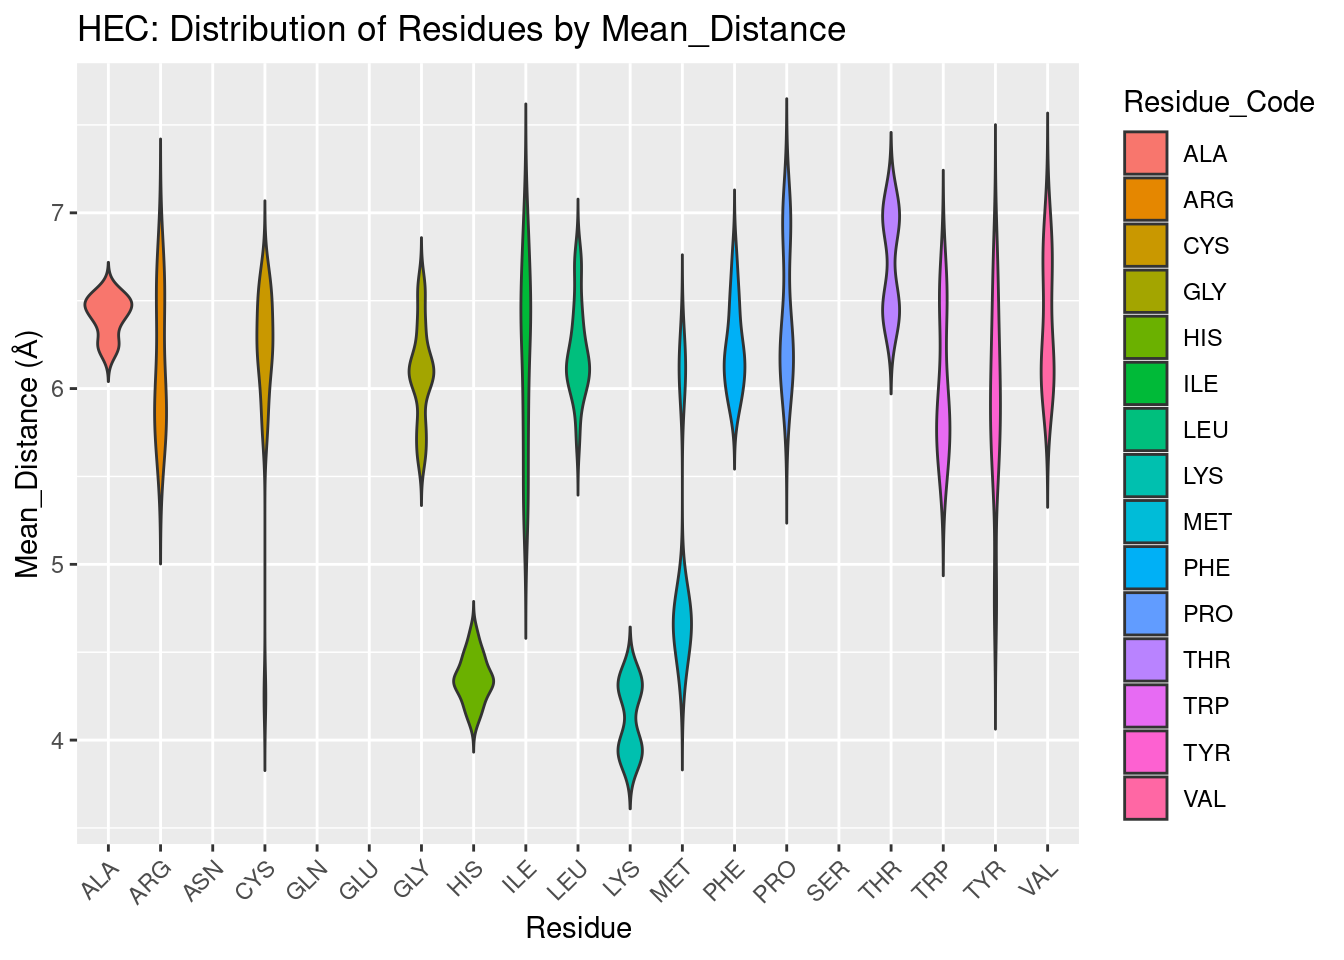
Figure 2.6: HEC: Residue Distribution by Distance
The distribution of amino acids over distance from the heme iron for HEC is similar to HEM, with some exceptions. Cys, His, Tyr again are amongst the closest residues to HEC, likely for the same reasons of very strong polar interactions or coordination. Additionally, cysteine forms covalent, thioether bonds with heme-c, providing further justification for its proximity. However, for heme-c, lysine and methionine also are very proximal. The methionine residues are nonpolar, small, neutral; lysine is polar and positively charged; neither of these residues are favored to be included in the heme-b binding environment despite very similar structures. The reason for their inclusion so close to the binding pocket is therefore unclear, but based on their distribution, and lysine being even more close proximity than heme, the results suggest these two residues may have important roles.
2.1.3 Verdoheme
2.1.3.1 Amino Acid Frequencies in Binding Pocket
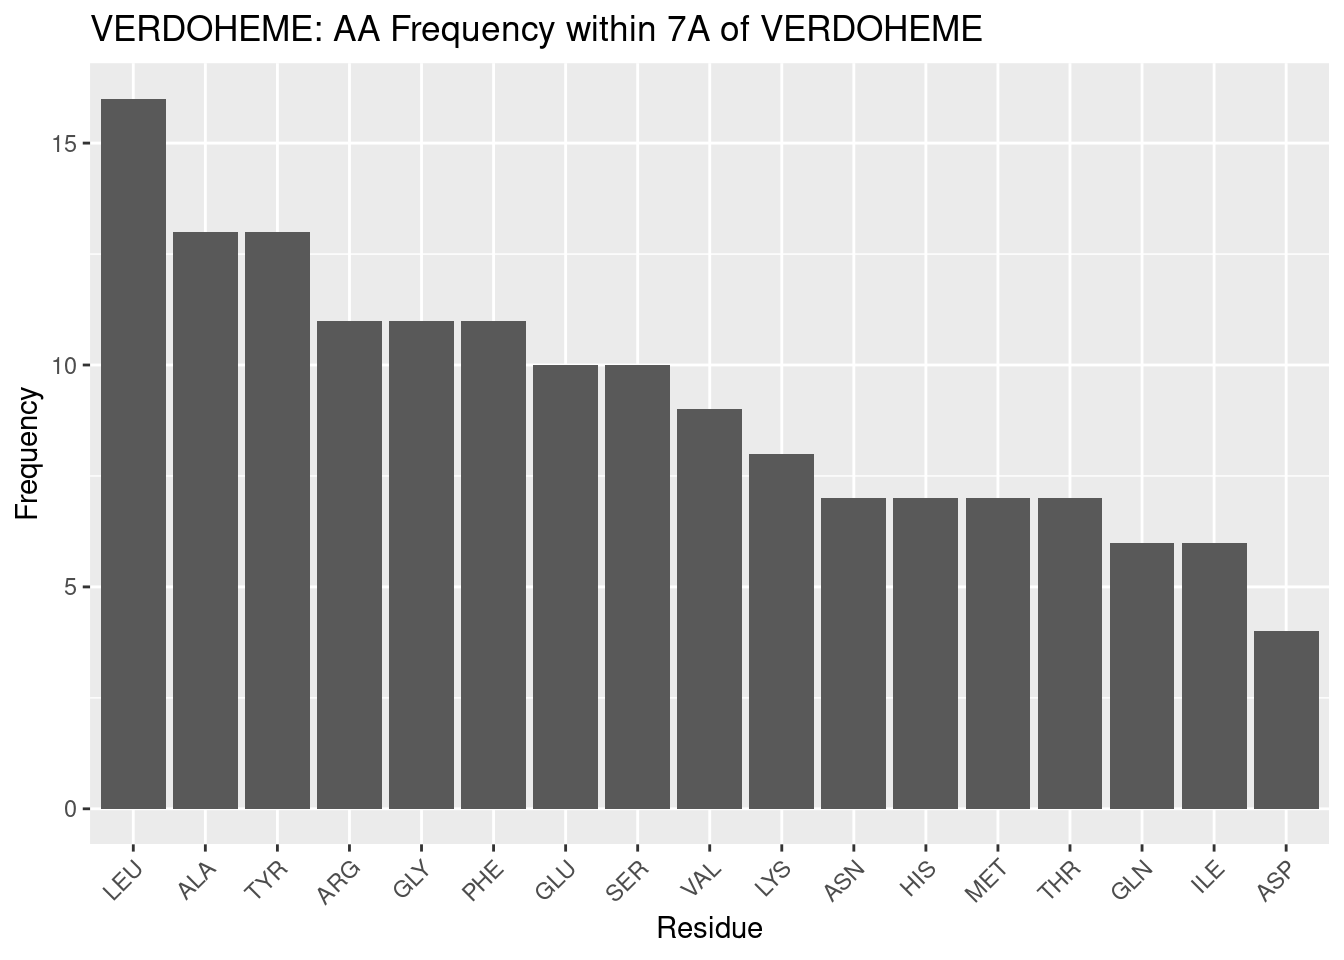
Figure 2.7: VERDOHEME: AA Frequency within 7A
| Residue | Freq |
|---|---|
| LEU | 16 |
| ALA | 13 |
| TYR | 13 |
| ARG | 11 |
| GLY | 11 |
| PHE | 11 |
| GLU | 10 |
| SER | 10 |
| VAL | 9 |
| LYS | 8 |
| ASN | 7 |
| HIS | 7 |
| MET | 7 |
| THR | 7 |
| GLN | 6 |
| ILE | 6 |
| ASP | 4 |
The frequqency of amino acids in the binding pocket for verdoheme is dissimilar from heme-b and heme-c above. This is fairly surprising, given that verdoheme is an intermediate in the binding pocket for heme-b within heme oxygenases.
Leucine and alanine are again most frequent, but after these, results diverge. Tyrosine and arginine are next most frequent - surprising, given that this is still the same pocket that bound heme-b. The data for heme-b indicate more frequent nonpolar residues before tyrosine. Chemically, it may be that as heme-b is oxidized, there is greater need for polar interactions; this would help to explain the high frequency of polar residues, but does not explain the shift in amino acid frequencies within what would be expected to be a similar binding pocket - all verdoheme PDBs in this in study were sourced from heme oxgenase proteins. Some heme oxygenases are included for heme-b, but they are amongst a diverse set of proteins. Therefore, the heme oxygenase environment may simply be host to more polar residues than normal for hemoproteins. This also agrees with tyrosine’s inclusion in redox reactions, and it may be favored to be present in heme oxygenase. These results indicate more about the heme oxygenase environment than the verdoheme binding environment - however, these two are inseparable, given verdoheme only appears in heme oxygenase. A dedicated investigation to the heme binding environment for heme oxygenase, may therefore be warranted in future study.
Glycine is the next most frequent - it is in lower frequency, relatively, for heme-b. As with other heme molecules, it is not clear as to what the role of glycine is in binding verdoheme.
2.1.3.2 Comparison with Background Amino Acid Frequencies
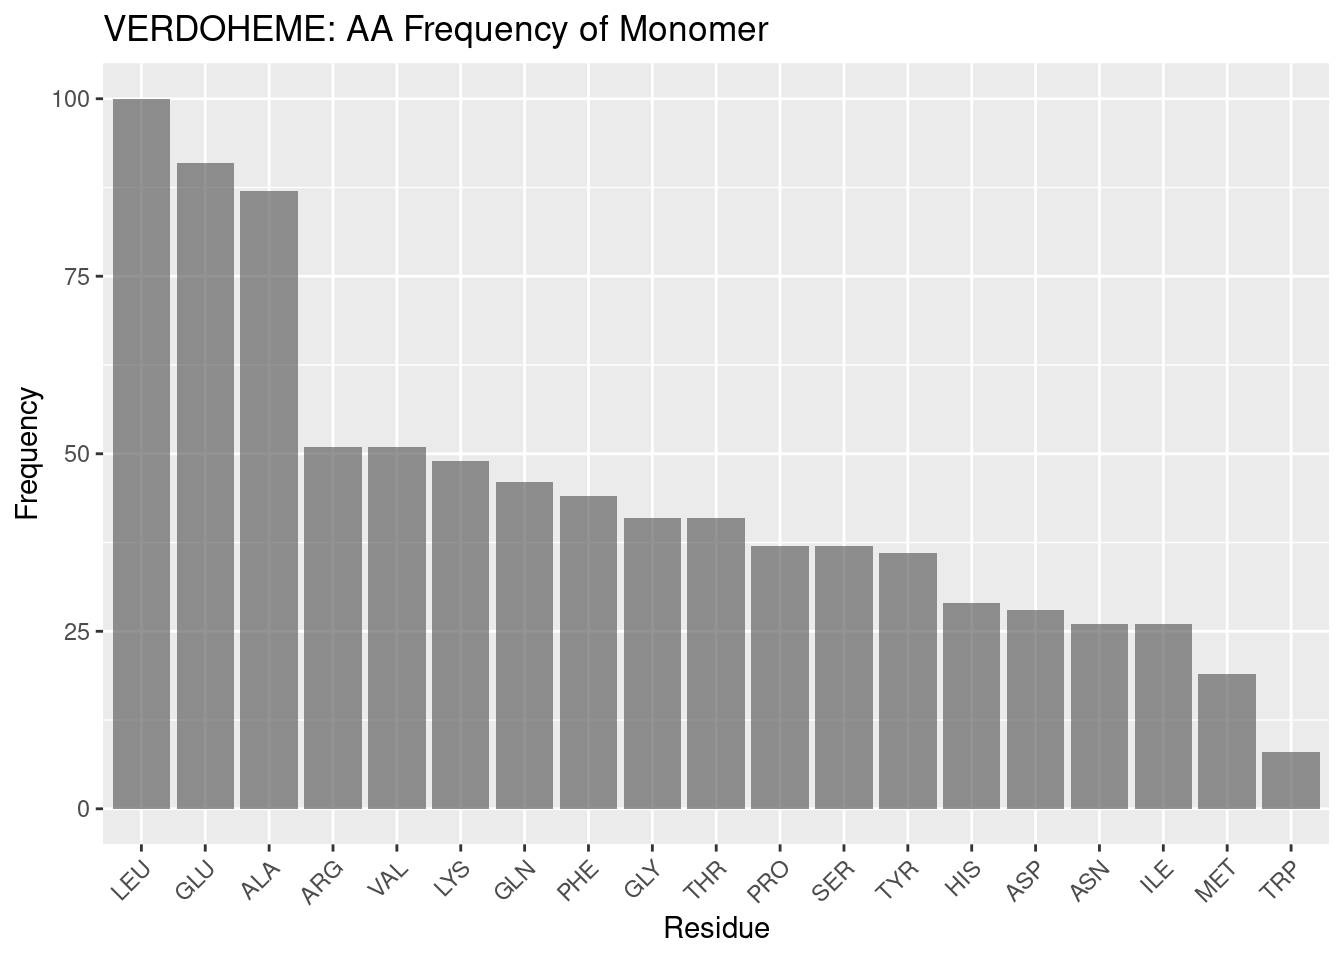
Figure 2.8: VERDOHEME: AA Frequency of Monomer
Besides the frequencies of leucine and alanine, which have been found for heme-b and heme-c above to be highly frequent in hemoproteins at large, the frequency profiles for the verdoheme binding environment and monomers is shown to be quite dissimilar, supporting the results for the binding environment as unique, not simply due to background frequency.
2.1.3.3 Distributon of Amino Acids by Distance
The low sample size for verdoheme leads here to a poor figure with few residues plotted. This is likely attributable to an insufficient amount of distances and residues to cross-reference against each other, an operation that successfully occurs for all similar graphs. Regardless, the data that are plotted will be discussed.
The highly conserved histidine for hemoproteins is exclusively within 5A for verdoheme. This result again suggests that at least some of the data for verdoheme may be highly biased because of the small sample size - heme-b data included a greater range for histidine. Or, perhaps for heme oxygenases heme is solely present to coordinate the iron atom, leading to all His residues being nearby verdoheme. The close proximity of glycine to verdoheme is also unexpected and unable to be explained without further study. The remainder of the residues plotted appear to follow the trends seen in for the other types of heme, with distance values centered around 6A and unremarkable distributions.
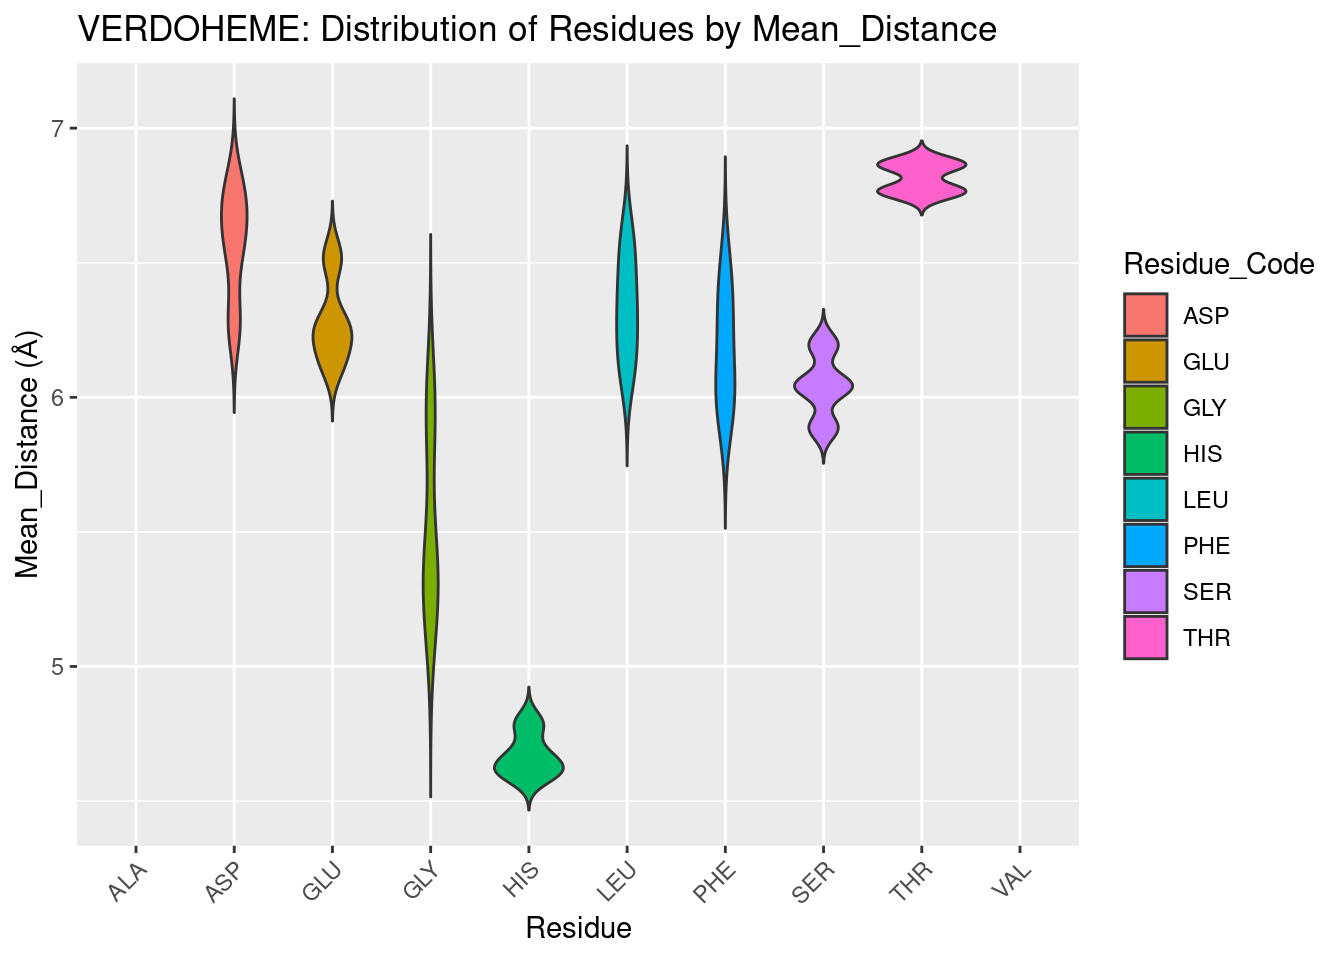
Figure 2.9: VERDOHEME: Residue Distribution by Distance
2.1.4 Siroheme
2.1.4.1 Amino Acid Frequencies in Binding Pocket
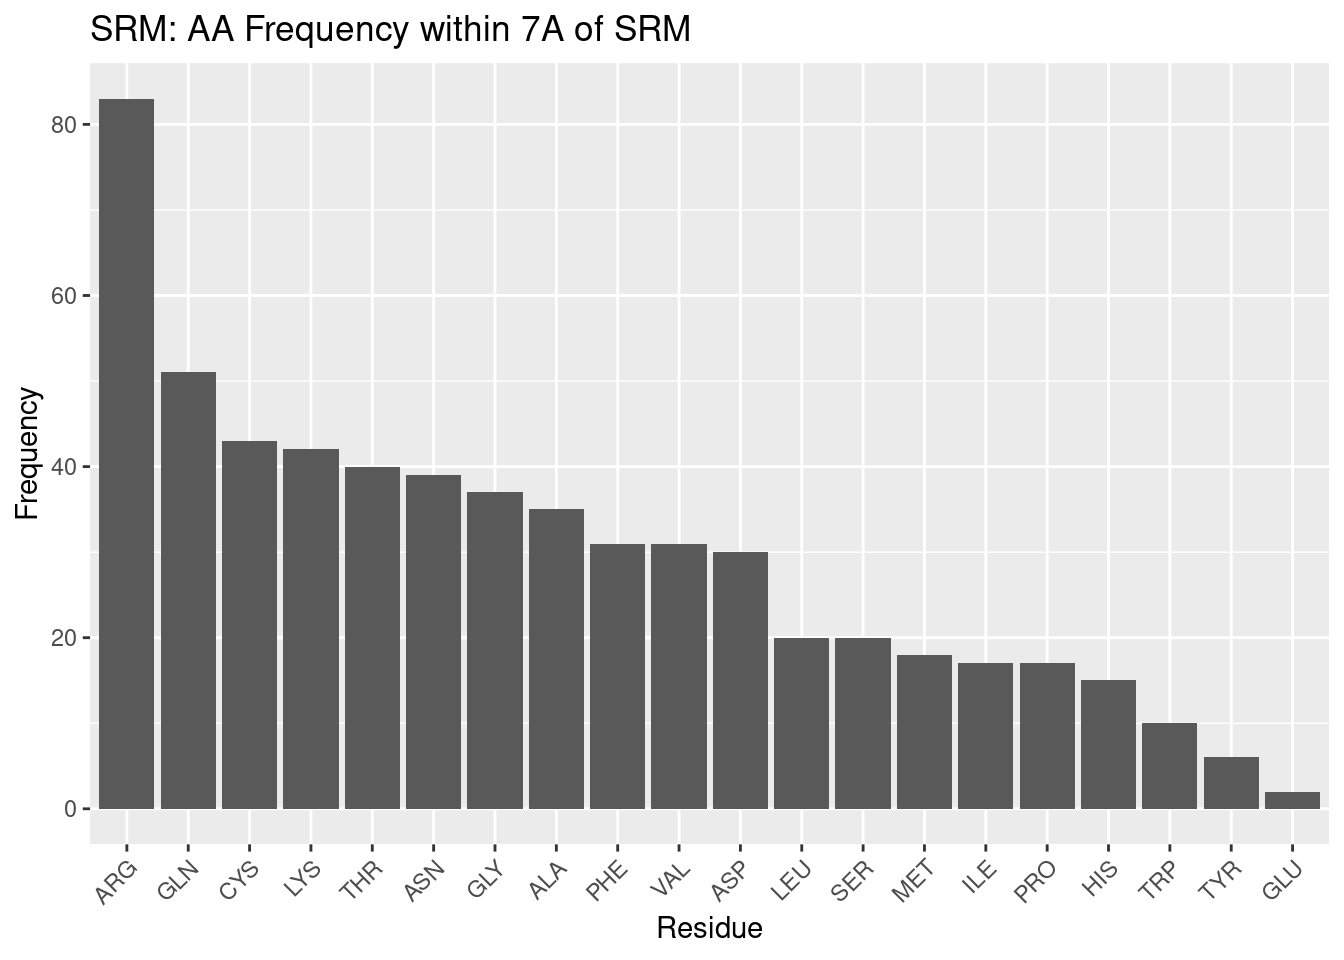
Figure 2.10: SRM: AA Frequency within 7A
| Residue | Freq |
|---|---|
| ARG | 83 |
| GLN | 51 |
| CYS | 43 |
| LYS | 42 |
| THR | 40 |
| ASN | 39 |
| GLY | 37 |
| ALA | 35 |
| PHE | 31 |
| VAL | 31 |
| ASP | 30 |
| LEU | 20 |
| SER | 20 |
| MET | 18 |
| ILE | 17 |
| PRO | 17 |
| HIS | 15 |
| TRP | 10 |
| TYR | 6 |
| GLU | 2 |
Siroheme, with a structure highly dissimilar to the other heme molecules examined, should be expected to have a different amino acid frequency profile – and indeed we confirm this in our results.
Nonpolar residues are not the most abundant in the siroheme binding pocket. In fact, disproportionately frequent to the rest of the residues in the binding pocket is arginine. Siroheme is saturated with carboxyl and propionate groups; the entire porphyrin ring surrounded by polar, electronegative groups. And therefore a polar, positively charged amino acid such as arginine is reasonable to expect in the binding pocket – what is striking, however is the extreme preference for arginine; such a profile does not exist for the other types of heme. This can be at least explained; siroheme contains propionate groups that likely still form polar interactions with arginine salt bridges, and the carboxyl groups may also form polar interactions with arginine, therefore highly favoring arginine’s presence in the binding pocket.
Arginine is followed by other polar amino acids: glutamine, cystine, lysine, threonine, and asparagine; a more homogenous trend than seen for the other heme molecules, in that the trend is not interrupted by residues of opposing polarity as for other types of heme. Though these results could be expected, they demonstrate the extent to which siroheme’s binding pocket is dominated by polar residues. The preference for arginine out of all polar amino acids may be attributed to its positive charge, and ability to form salt bridges that interact with the propionate groups; lysine also has a positive charge and is polar, but does not form salt bridge interactions with the propionate groups. Cysteine is used to coordinate the iron of siroheme, and while this did not significantly affect the frequency for other heme molecules, it is still possible this increases the value for cysteine for siroheme.
After this group of polar amino acids, glycine is the next most frequent. Glycine has been situated at about a median frequency for other heme molecules, so perhaps its frequency here, slightly above the median, is of note. Again, for glycine in particular, the reason for its particular frequency cannot be determined from this data, but it appears to have some role.
Finally we come to several nonpolar amino acids: alanine, phenylalanine, and valine. These amino acids define roughly the median of the frequency data. With all the polar groups on siroheme, it might be expected that only polar interactions would be desirable. However, the not minuscule frequency of these residues suggests nonpolar interactions still occur in the binding pocket; the porphyrin ring remains, as well as some methyl groups.
After these nonpolar residues the remaining frequencies do not follow a clear trend but regardless are discussed. After aspartate the remaining frequencies are considerably lower. This may be an artefact of a small sample size, or may suggest the remaining residues form, if any, far less favorable interactions with the heme.
Aspartate appears next most frequently; it is a polar, negatively charged amino acid (at pH 7). Siroheme is saturated with other electronegative groups; perhaps there is some repulsion between these groups and aspartate – this could explain why, despite being a polar residue, arginine does not appear very frequently in the binding pocket.
Leucine is the first of the residues of diminished frequency. It is nonpolar. It, and, skipping a frequency, methionine, isoleucine, and proline, appear less frequently, and therefore are likely disfavored from forming the relatively few nonpolar interactions that do occur. Why is not clear - other small, nonpolar residues, and other lengthy nonpolar residues appear in the pocket in greater frequency.
Serine appears just less frequently than leucine, and in this context may likely be considered a polar residue that is not as strongly polar or positively charged and therefore less preferred to include in the binding pocket to form polar interactions with siroheme as other residues.
Histidine appears quite infrequently. As with siroheme, other, more strongly polar and perhaps less bulky residues are likely preferred.
Tryptophan is the least frequent nonpolar residue. The presence of a weak hydrogen bond and its size may preclude its inclusion in the binding pocket in lieu of more uniformly nonpolar residues that take up less space and can better form interactions with the few nonpolar areas of siroheme.
Tyrosine and glutamate are the least frequent polar residues. This is in stark opposition to the other heme molecules - tyrosine seemed to be favored for other heme molecules to form interactions with the propionate groups. Glutamate is also extremely infrequent, even in spite of its similarity to aspartate. Both are electronegative at pH 7 - glutamate’s extra carbon may provide sufficient steric hindrance to render it less favored. In either case, the infrequency of these residues and the tendencies of other, more intensely polar or nonpolar amino acids to be more populous, suggests tyrosine and glutamate, in the siroheme binding environment, do not interact strongly enough to be favored over other polar residues.
2.1.4.2 Comparison with Background Amino Acid Frequencies
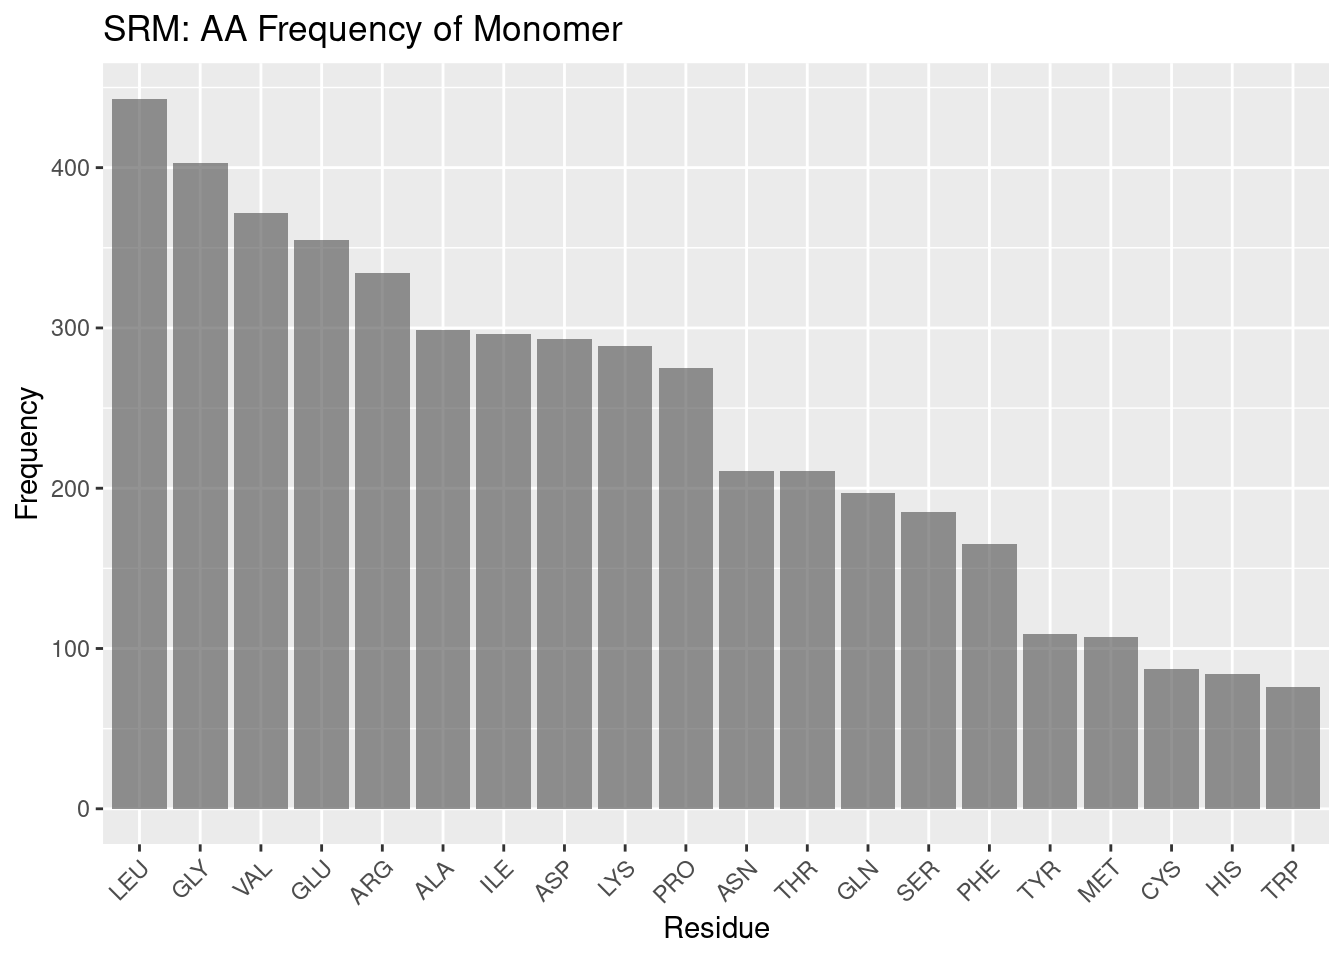
Figure 2.11: SRM: AA Frequency of Monomer
Compared to the other heme molecules, siroheme’s binding pocket amino acid frequencies are even more different than the background frequencies. Arginine is far and away the most frequent amino acid in the binding pocket; leucine is the most populous amino acid in the monomer overall, seeming to follow a trend amongst the hemoproteins examined so far. Again, discussing the remainder of the frequencies of the monomer would be conjecture, but it is worthwhile to note that the pocket frequencies appear unique against the background.
2.1.4.3 Distributon of Amino Acids by Distance
Residues appear less uniformly distributed over distance for siroheme binding pockets when compared against the distribution for other heme molecules. Cysteine is the only residue that comes within 5A of siroheme; it is used to coordinate the iron in siroheme, so this result is expected. The lack of other residues being within 5A, differing from other heme molecules, suggests the many carboxyl and propionate groups on siroheme prevent, or preclude the need for closer interaction except for coordinating residues.
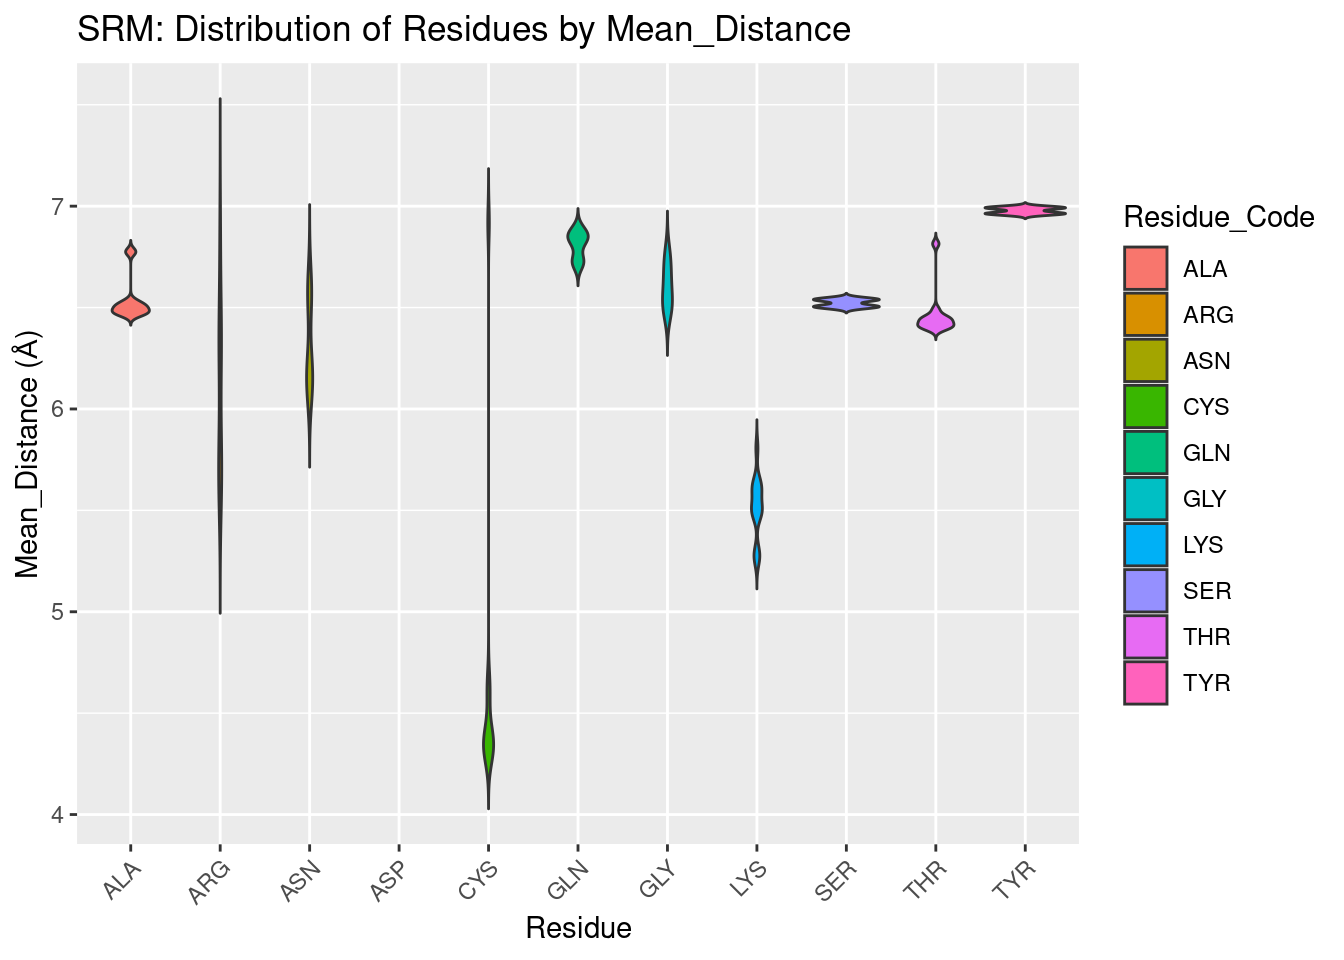
Figure 2.12: SRM: Residue Distribution by Distance
2.2 Volume of Heme Binding Pockets
Figures are shown below.
Volume results were rather spread out, with close agreement only found for heme-b. In general, volume for all heme molecules regardless of distance cutoff centered at approximately 1200 A³. This result may be useful in protein engineering efforts, especially for selection or design of binding pockets.
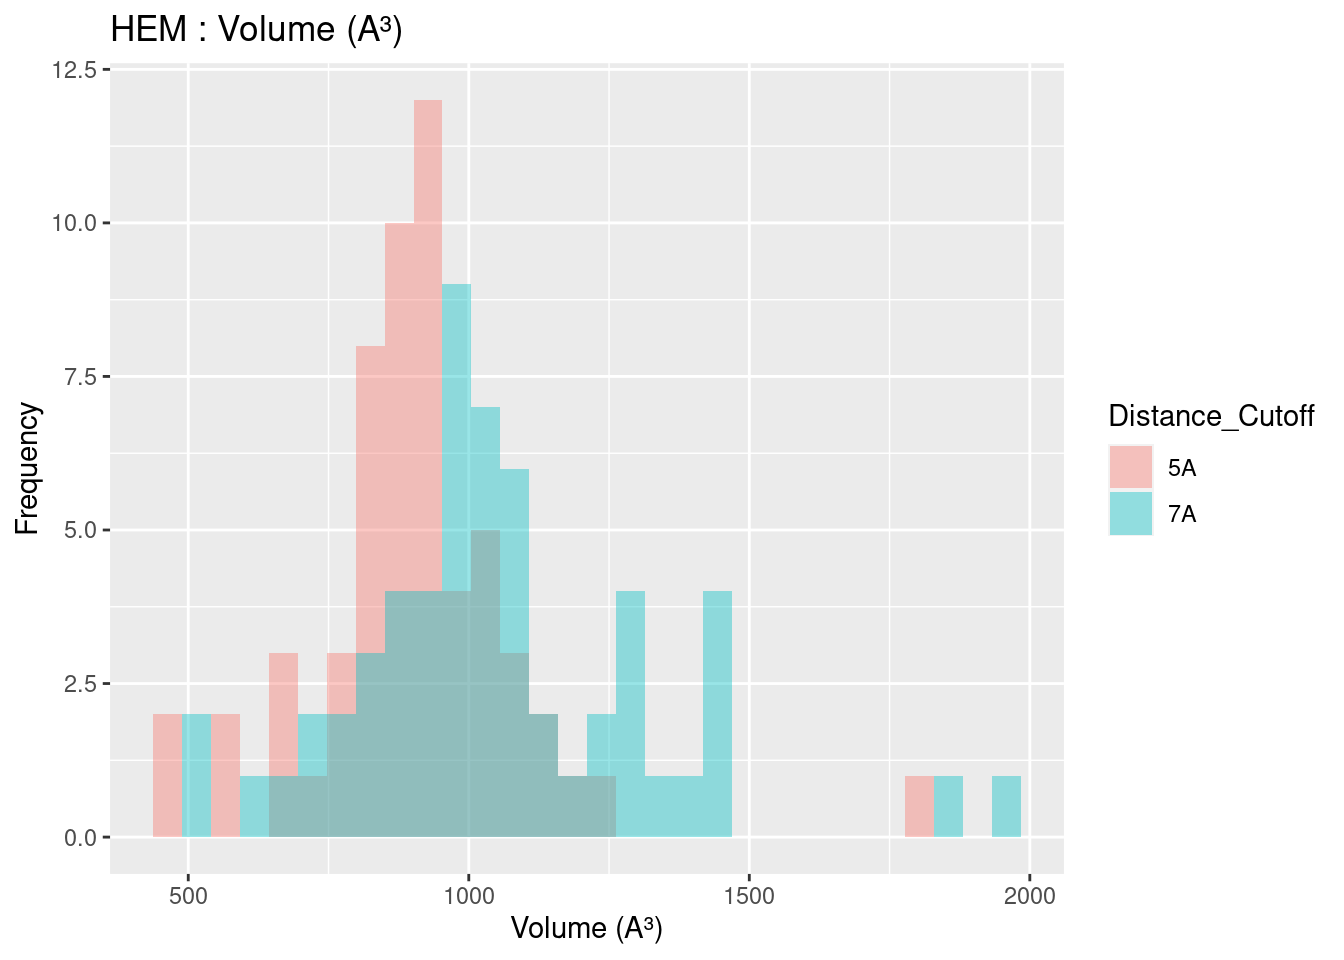
Figure 2.13: HEM: Volume of Binding Pocket
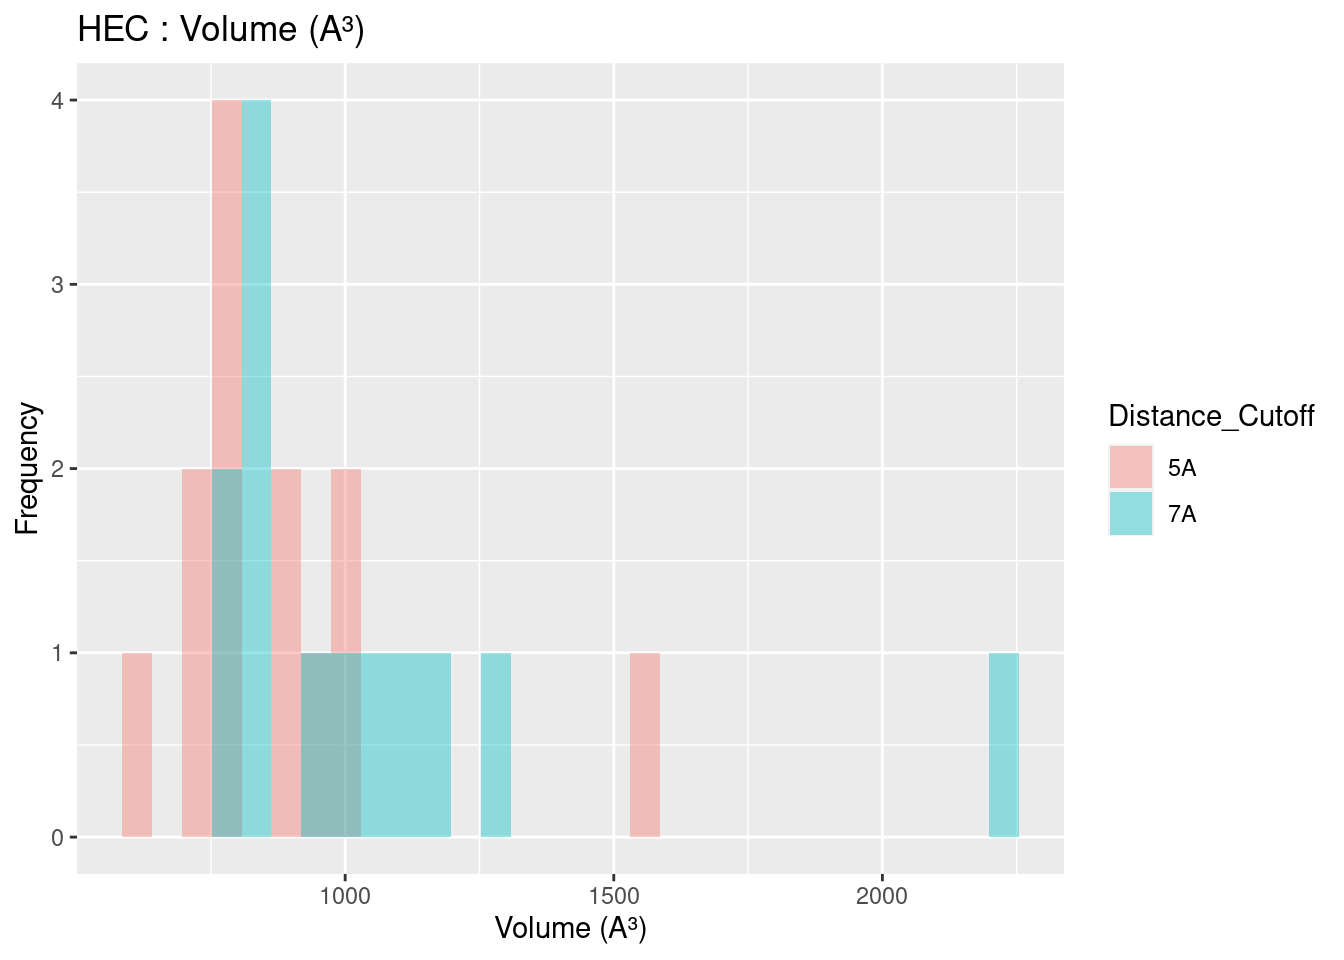
Figure 2.14: HEC: Volume of Binding Pocket
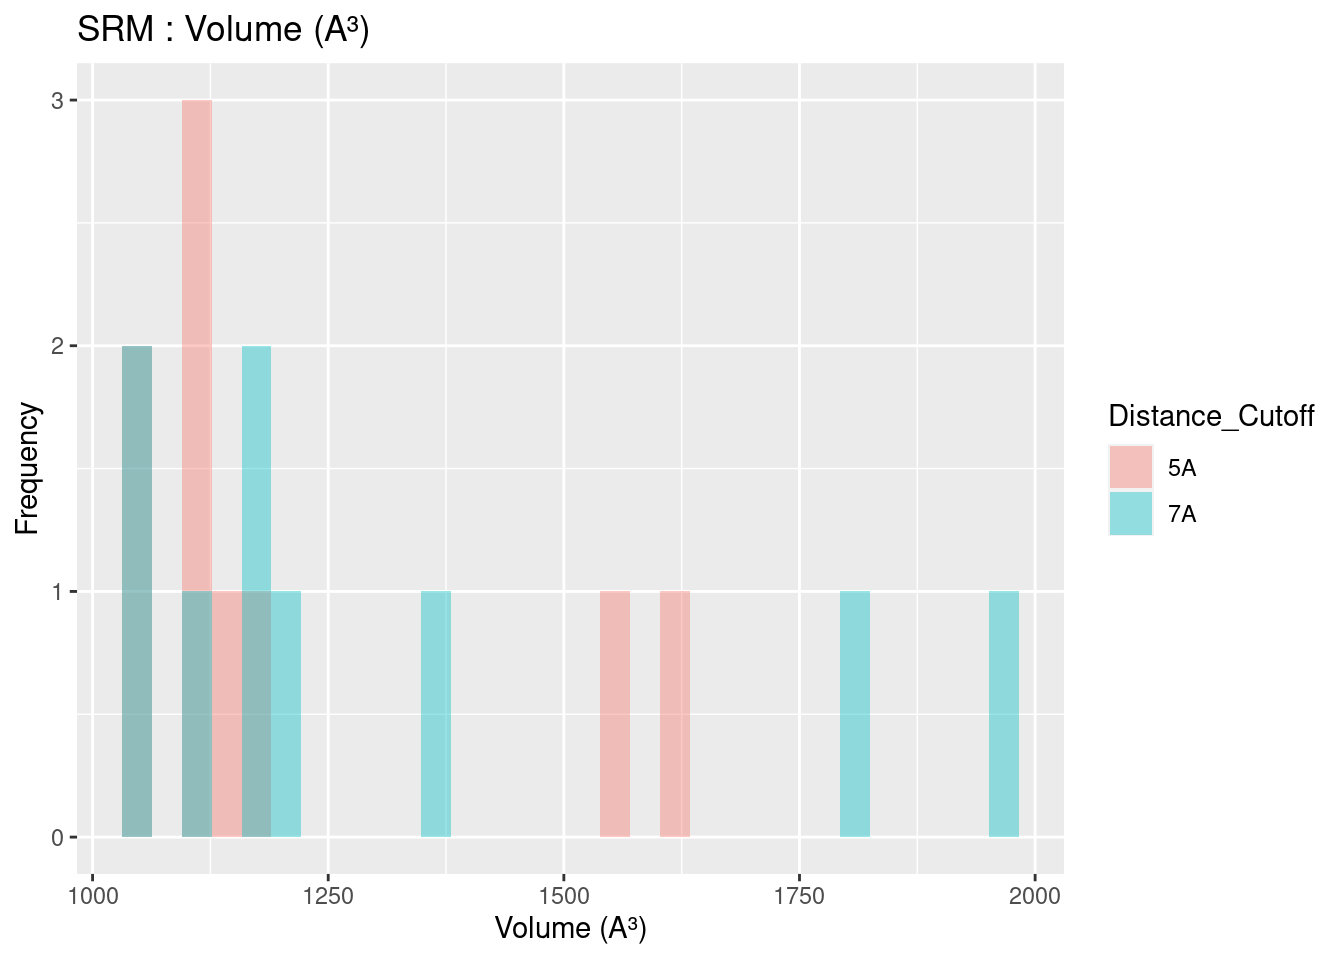
Figure 2.15: SRM: Volume of Binding Pocket
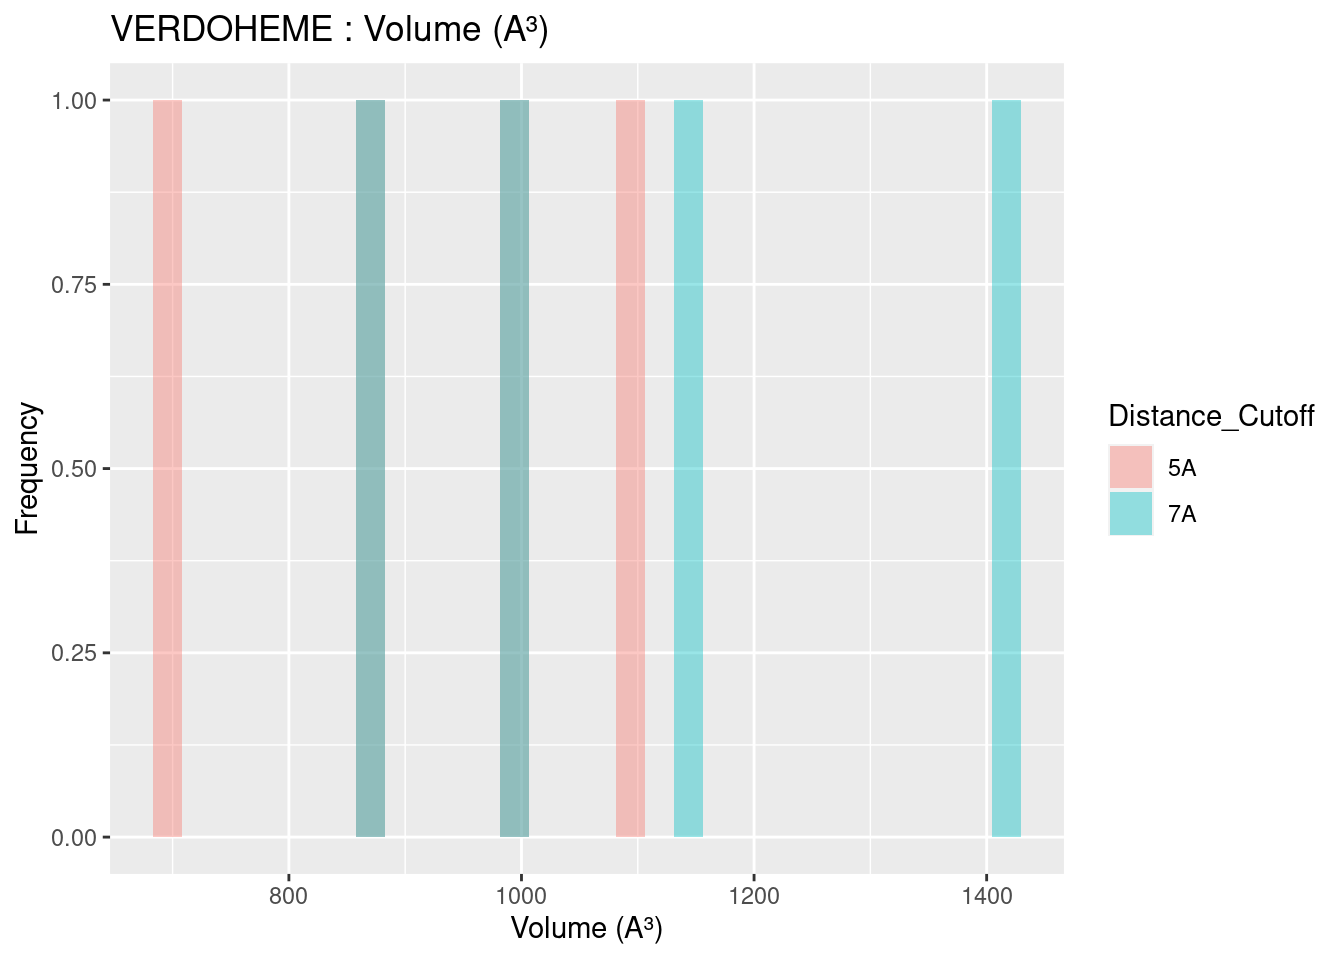
Figure 2.16: VERDOHEME: Volume of Binding Pocket
2.3 Surface Areas of Heme Molecules and Their Binding Pockets
2.3.1 Surface Area of Heme Molecules
Both solvent accessible and solvent excluded surface areas were calculated for heme molecules and binding pockets. The differences between these two measures were discussed in Section 1.3.3. The results are extremely similar for solvent accessible and solvent excluded surface areas; and therefore only solvent accessible surface area, a measure more practically interpreted into chemical phenomena, is discussed below. Figures and data for solvent excluded surface areas are available in Appendix A.2, A.3, and B.4. Solvent accessible surface area figures are shown below; data tables are available in Appendix B.4.
The solvent accessible surface area for all heme molecules themselves centers around values of 1000 A². This result is reasonable, given the similarity in size and structure of all heme molecules, in spite of the attached groups. Figures are shown below; full data tables are available in Appendix B.4. The extreme outliers are likely artefacts of the method used to calculate surface area and potential conflicts with the method used to convert multimeric proteins to monomers.
2.4 Ligand Solvent Accessible Surface Area
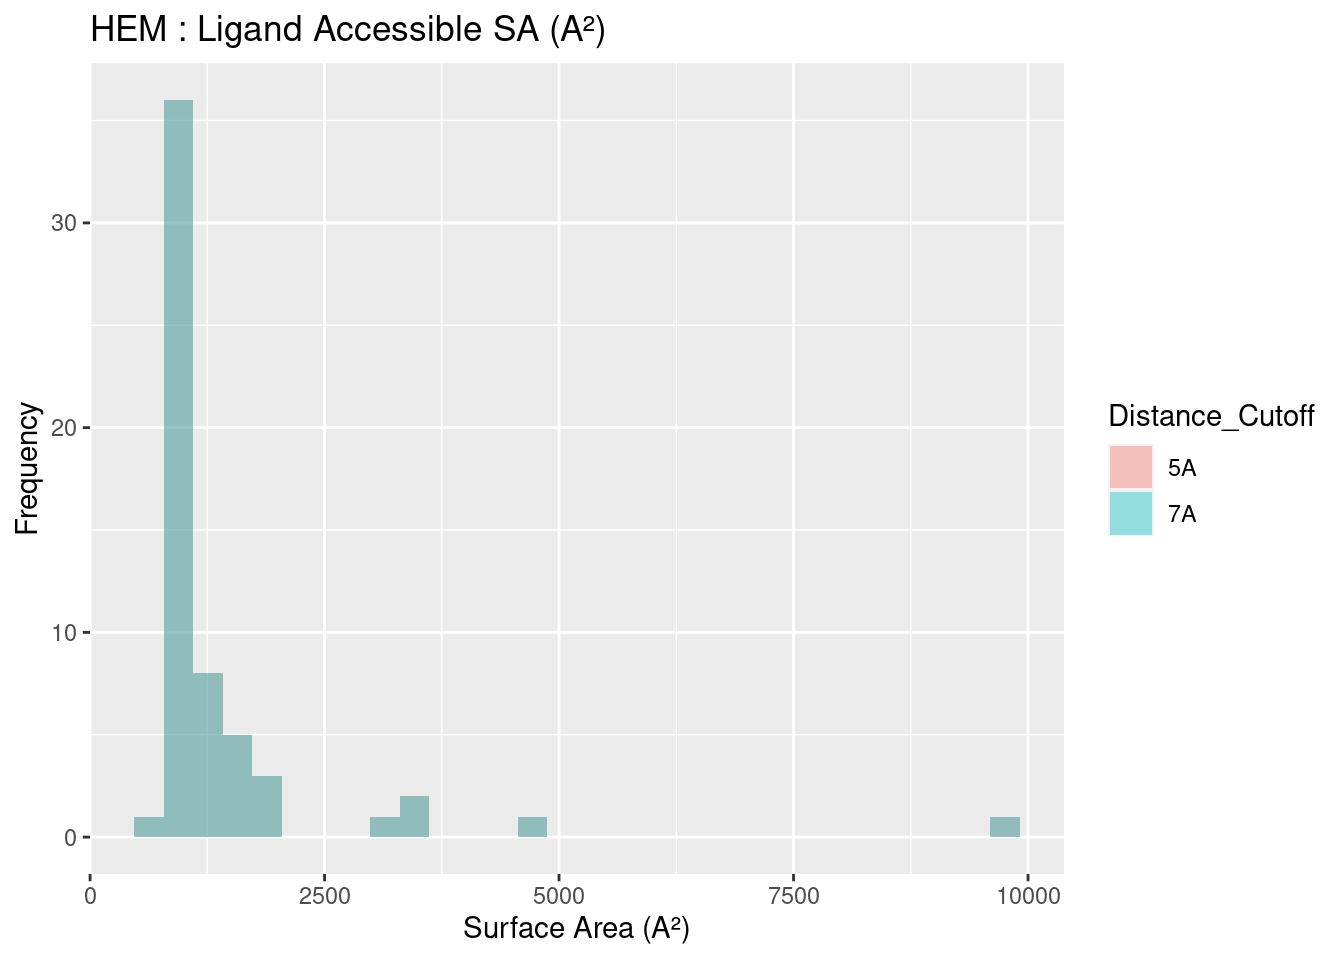
Figure 2.17: HEM: Ligand Accessible Surface Area
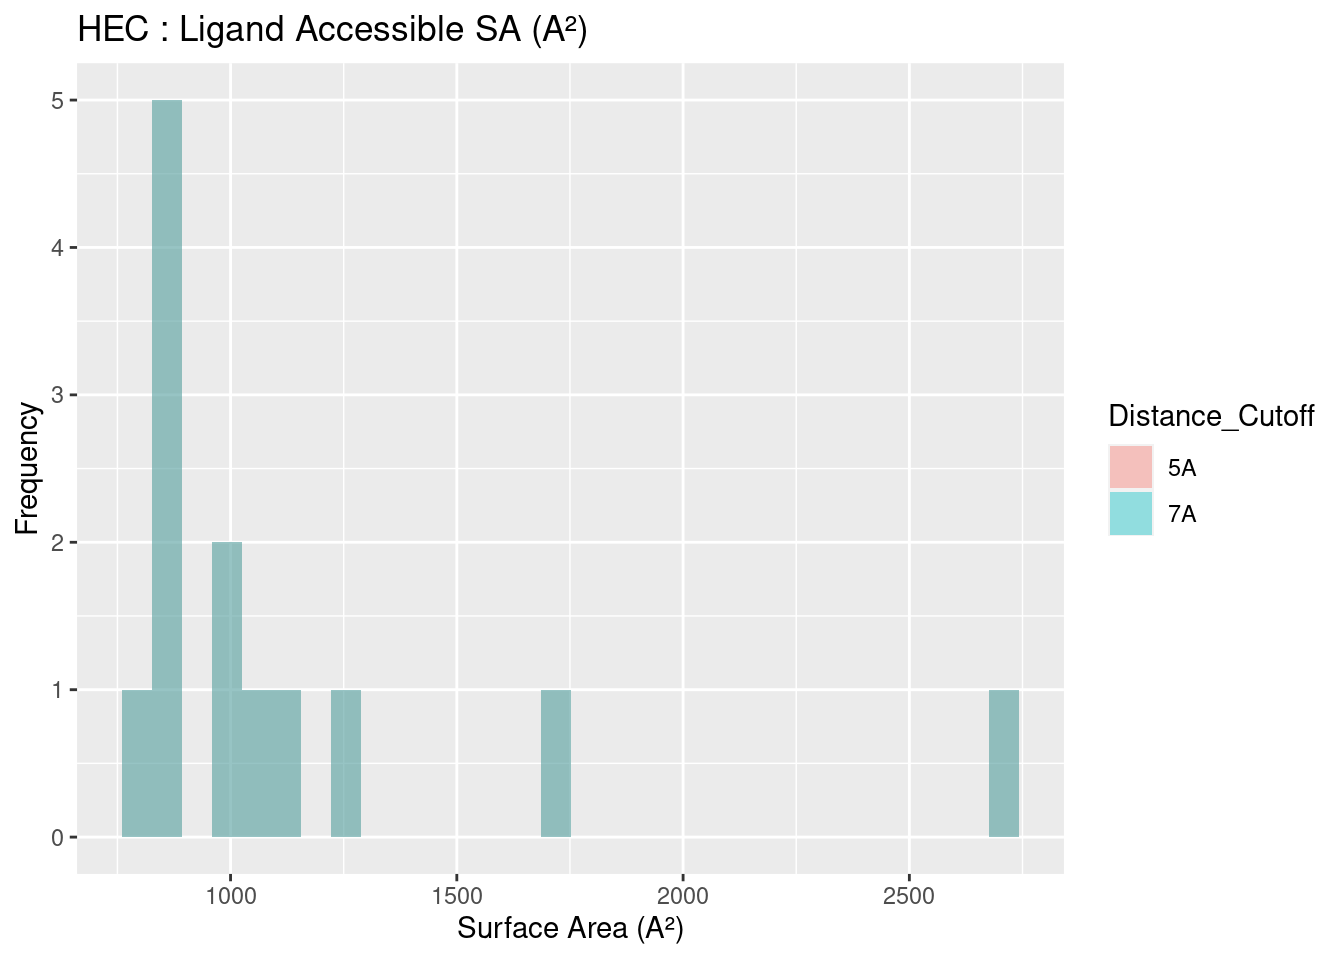
Figure 2.18: HEC: Ligand Accessible Surface Area
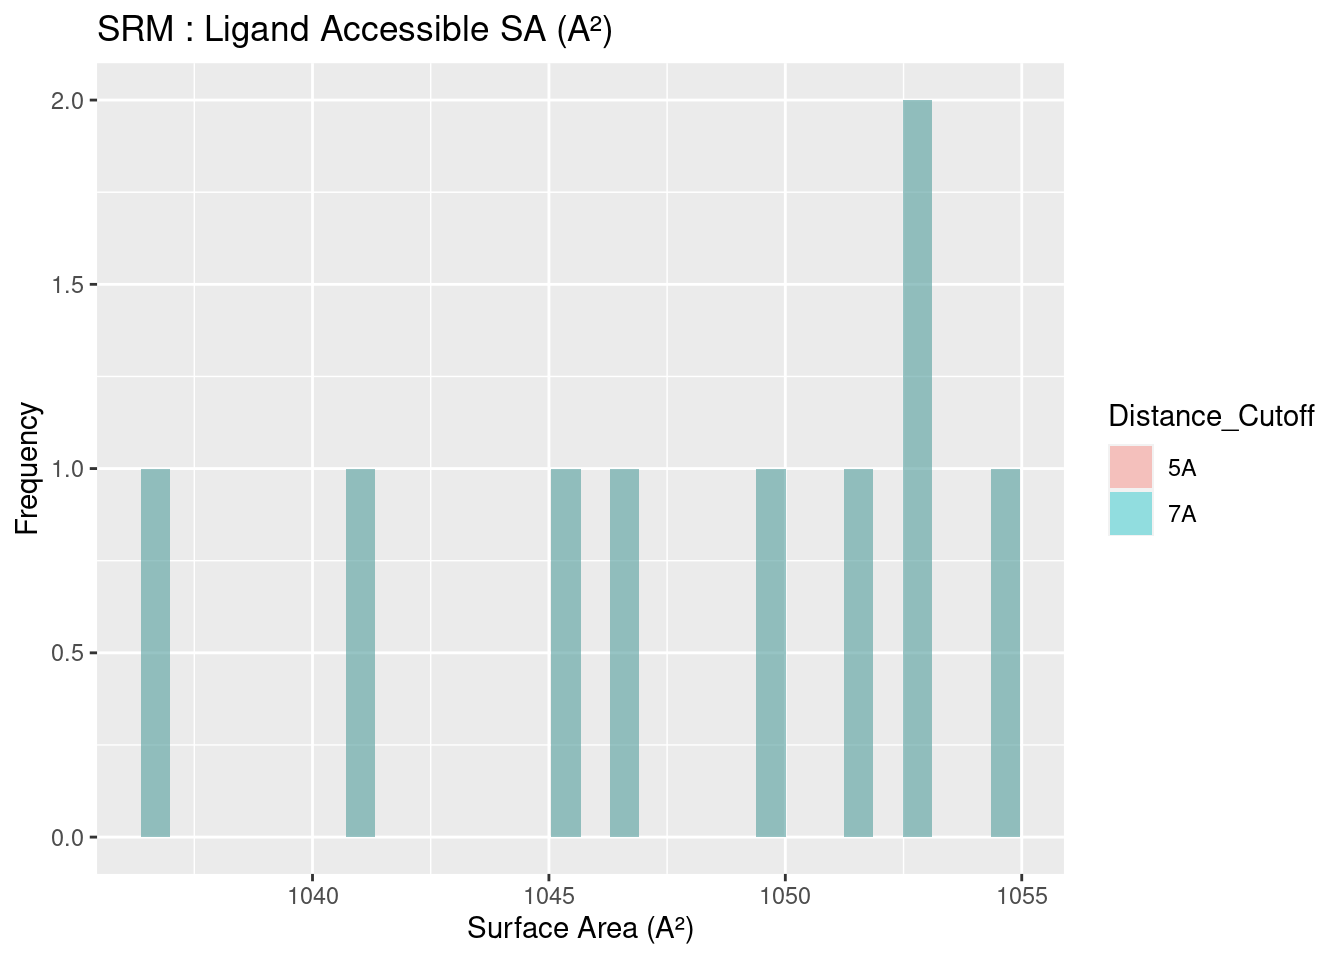
Figure 2.19: SRM: Ligand Accessible Surface Area
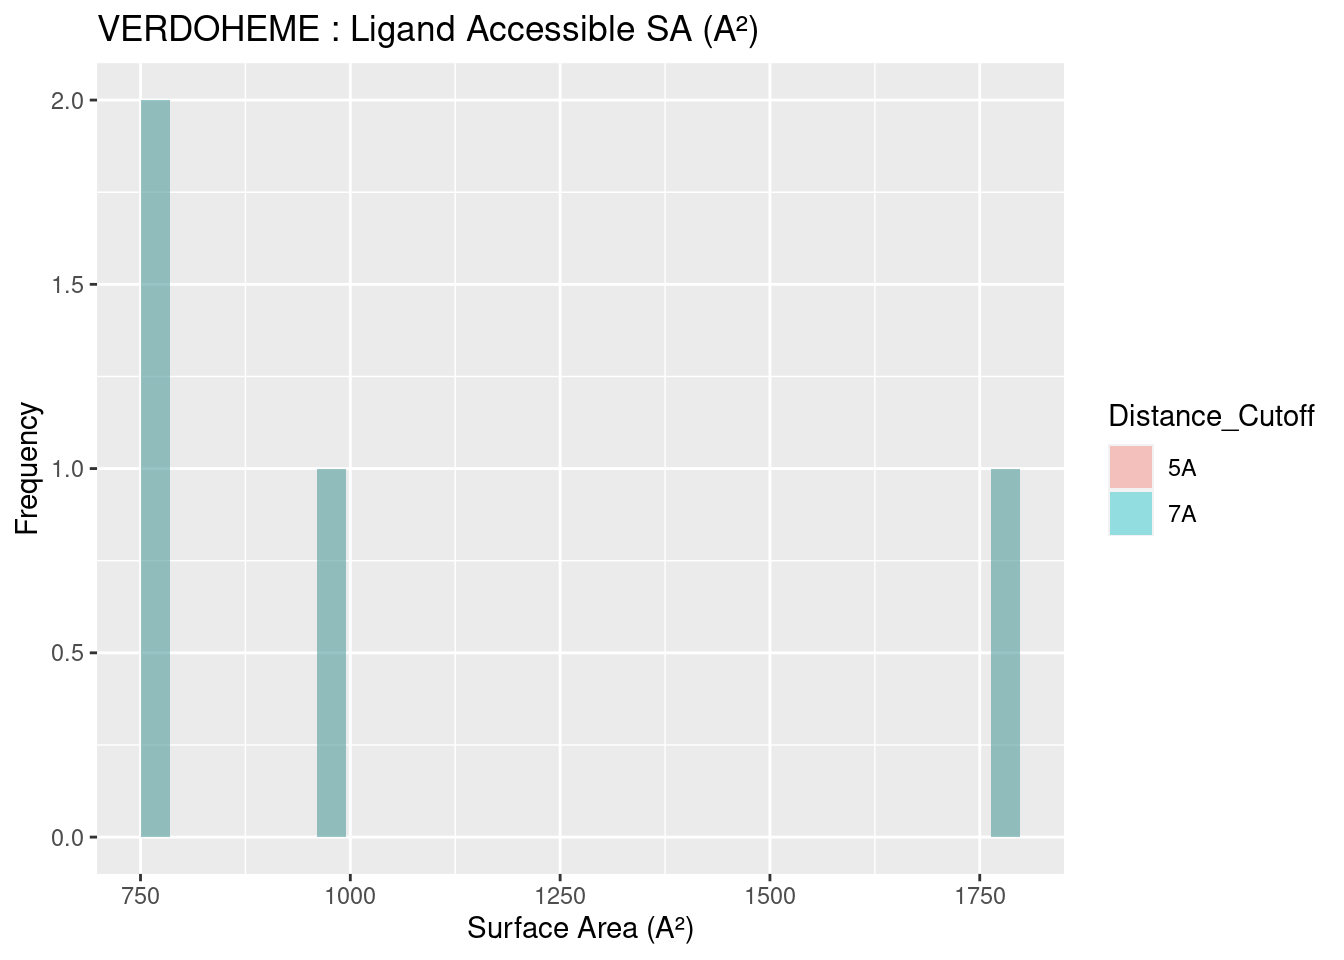
Figure 2.20: VERDOHEME: Ligand Accessible Surface Area
2.5 Pocket Solvent Accessible Surface Area
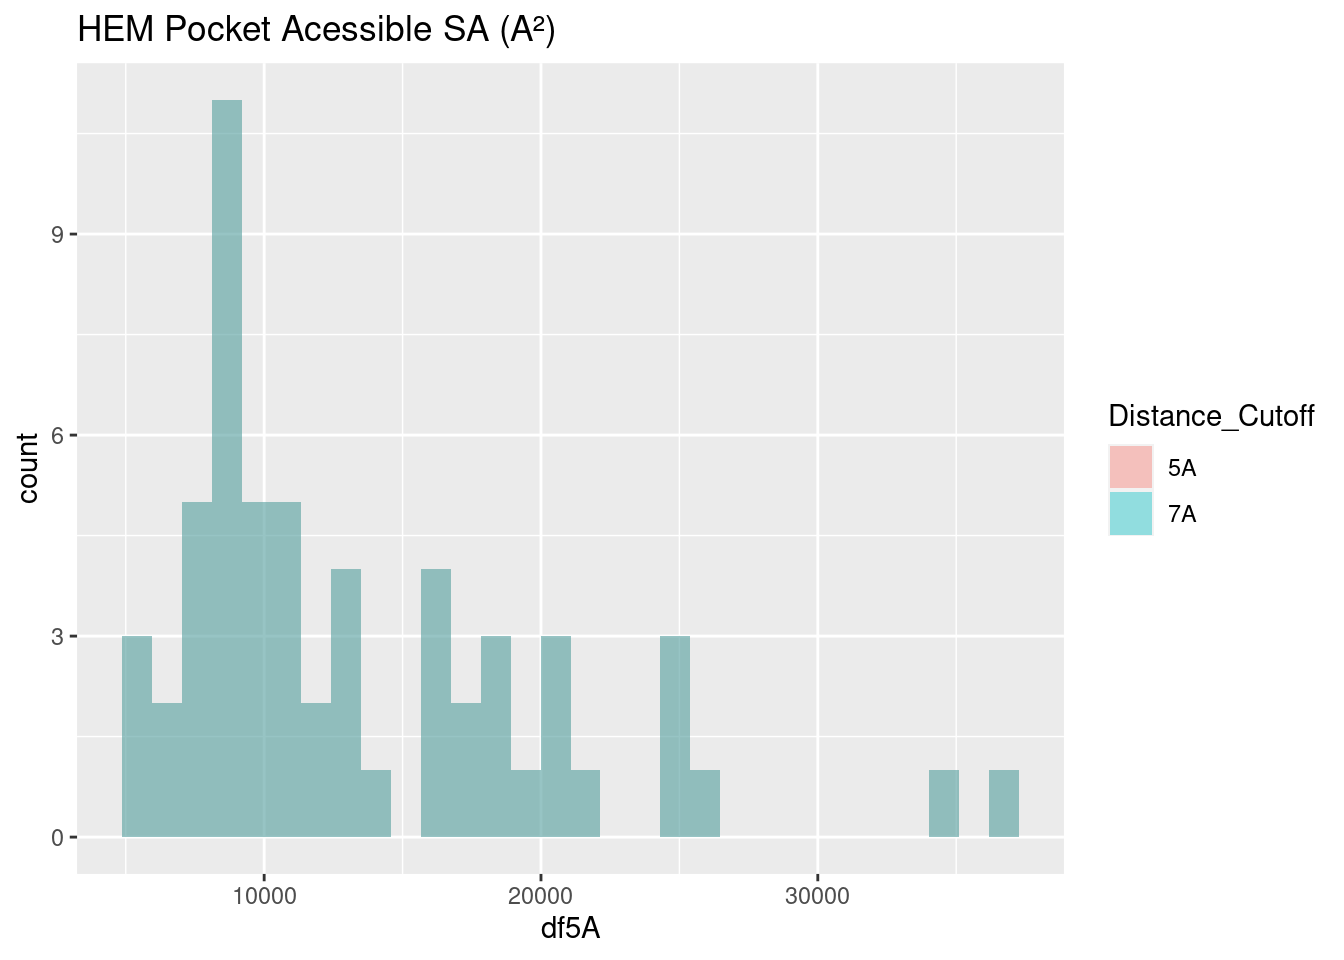
Figure 2.21: HEM: Pocket Accessible Surface Area
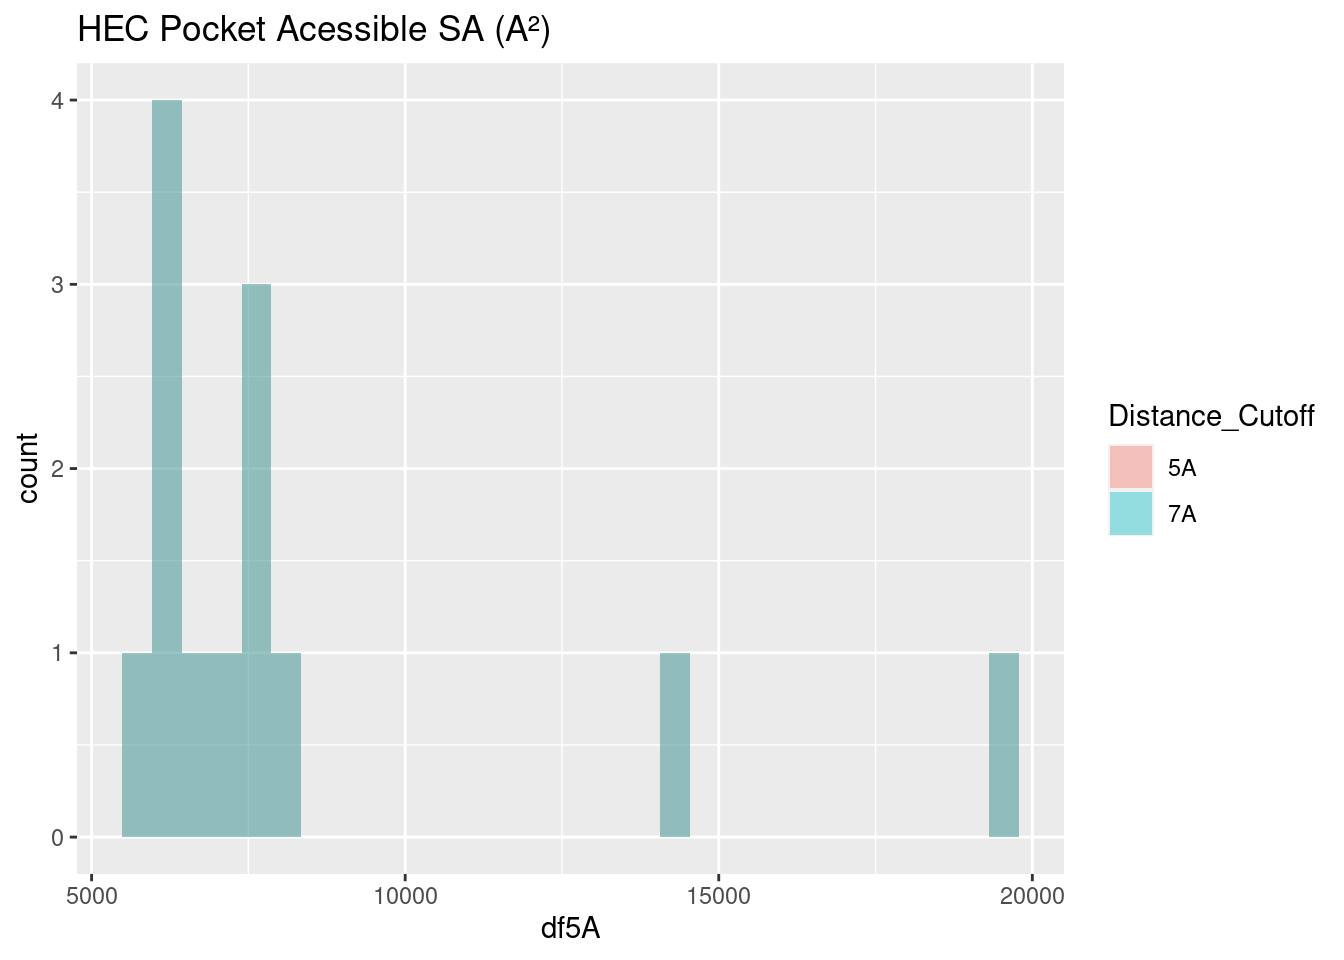
Figure 2.22: HEC: Pocket Accessible Surface Area
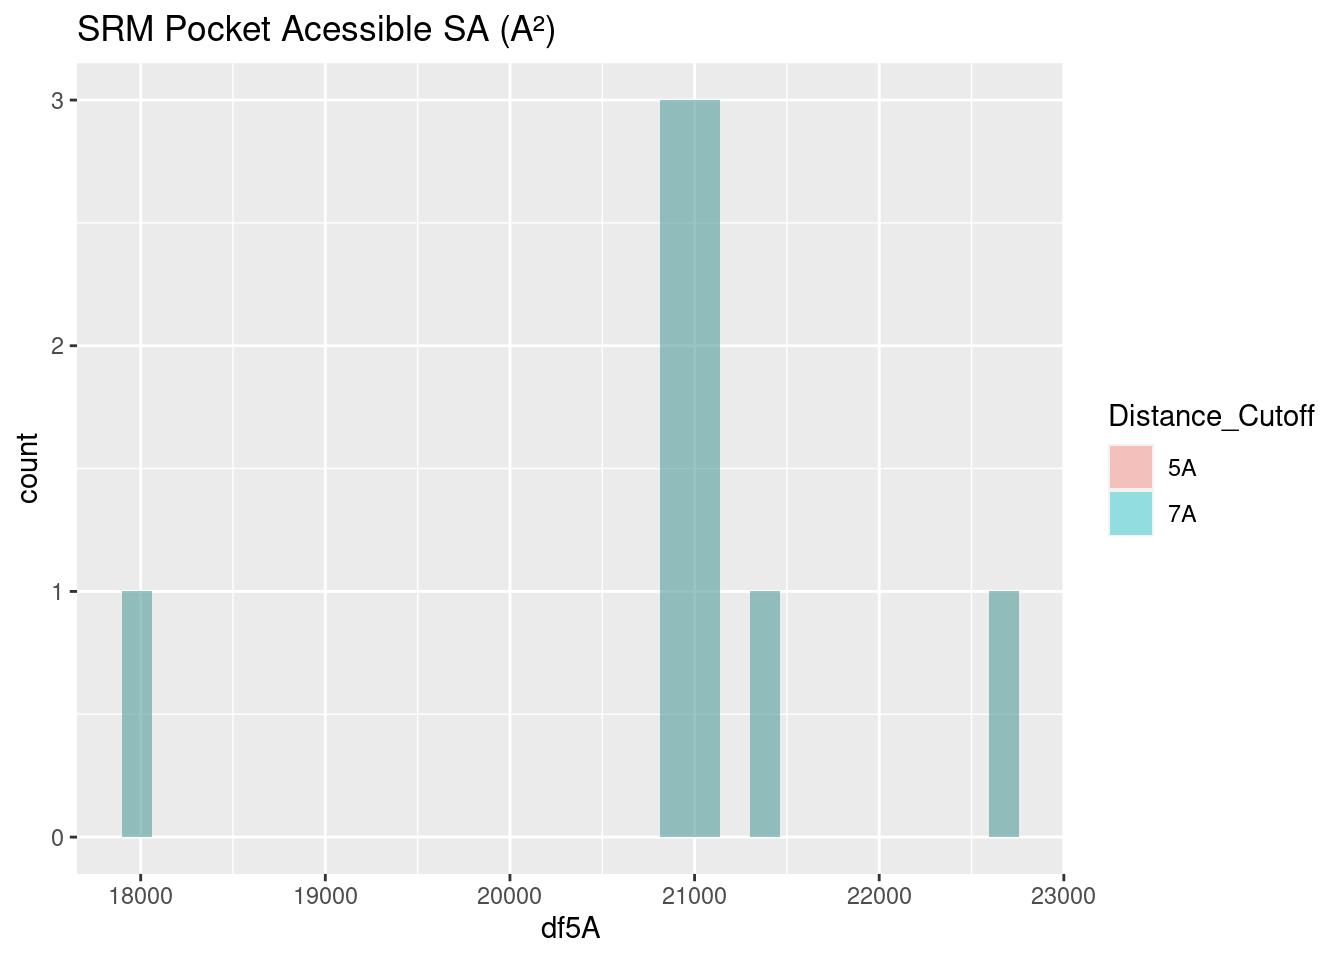
Figure 2.23: SRM: Pocket Accessible Surface Area
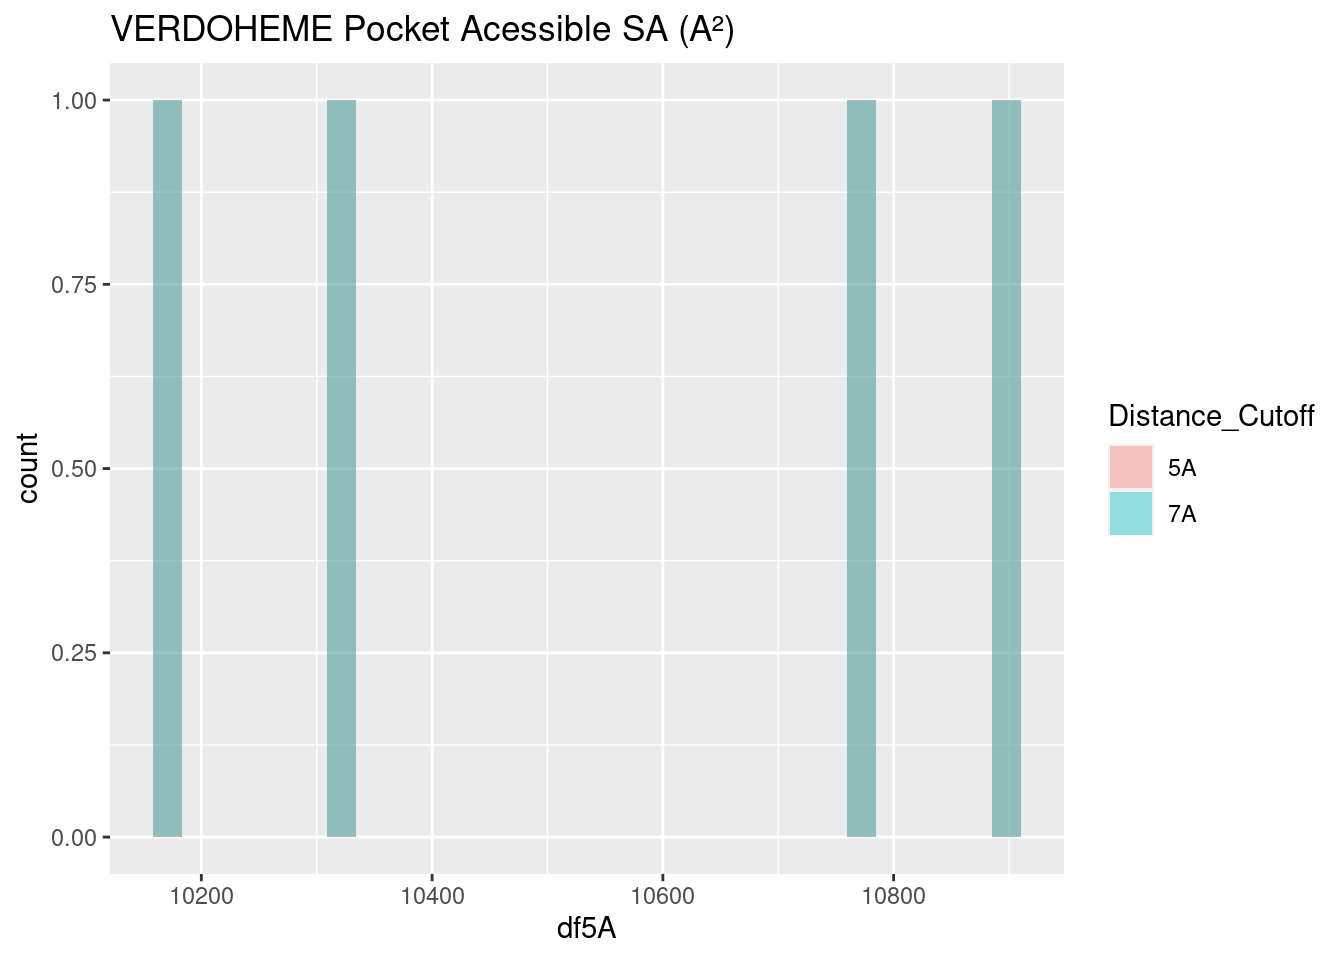
Figure 2.24: VERDOHEME: Pocket Accessible Surface Area
The surface area of binding pockets is more varied than the heme surface areas.
Heme-b and verdoheme, being highly similar molecules, with the same propionate groups, and one the derivative of the other, have quite similar surface areas, centering around 10,000-11,000 A². This is useful as a baseline to discuss the surface area of the binding pockets of the other two heme molecules below.
The surface area of the binding pocket of heme-c is considerably lower than that of heme-b and verdoheme. Its values center around 7500 A². Heme-c is bound covalently to the hemoprotein, forming thioether bonds with cysteine residues at two sites; this result suggests that the covalent bonds may exclude these sites from interacting with water molecules. Further study would be required to confirm this phenomenon.
The surface area of siroheme’s binding pocket is far greater than that for other heme molecules: values center around 21000 A². Siroheme’s extra groups on the porphyrin ring do not appear to affect its own surface area, per above. However, it is effectively a very polar molecule and appropriately the binding pocket is highly saturated with very polar amino acids, as seen in the amino acid frequency analysis. The binding pocket is therefore completely different from the other heme molecules, and these populous, polar amino acids favorably interact with aqueous solvent, negating the need to bury any hydrophobic residues and reduce surface area.
2.6 Angular Data
As briefly mentioned in the introduction, angular data was generated but will not be discussed extensively. Figures may be found in Appendix A.4 and A.5 data tables may be found in Appendix B.5 and B.6. Amongst the results are tight distributions of planar angles and CA-CB-Fe angles for some residues; but much of the data demonstrates a broad range of angles that may be formed. The data may be useful for protein engineering and residue placement, but cannot be productively discussed and are therefore relegated to the appendices.
2.7 Limitations of the Study
A high throughput framework was built to conduct this study. However, guaranteeing the quality of PDBs to enable the scripts to function properly proved challenging, and the sample size is small, although diverse. This problem only exists for heme-b and heme-c – for siroheme and verdoheme, all structures in the PDB capable of being used, were used. Heme-b and heme-c would only require more trial and error, or pre-processing, to be input to the framework that has been built.
Although many hypotheses have been suggested in the discussion to explain the data, limited experimental data exists to confirm them. Future work may include wet lab experiments to confirm these hypotheses, such as mutating several hemoproteins to contain higher or lower percentages of nonpolar residues in the binding pocket, and observing how the binding of heme is affected.
Some of these data could also be analyzed more thoroughly, for example eliminating the coordinating amino acids from the amino acid frequency data. This was not possible here due to how the framework is constructed: coordinating residues are not identified, nor is a definition proposed to identify coordinating residues. Manual input of known coordinating residues would be necessary to be certain that they could be eliminated from the final dataset analyzed, but this was beyond the scope of this study.
UCSF-Chimera was used to generate all data used in this study; many algorithms have remained unchanged for some time (surface area calculations are sourced from MSMS (1996) and volume calculations from Surfnet (1995)). It would be well to compare with any new algorithms that are developed to calculate surface area or volume, or with any experimental data that may be used confirm these numbers.
The reason being for this desired orthogonality is that the algorithms themselves may certainly introduce bias based off how they work. Surfnet generates 3D-contour surfaces to identify cavities; in practice, many small “bubbles” or insignificant cavities were generated in the study, and are filtered out during analysis – the parameters chosen can also significantly influence the behavior of the algorithm; in this study, the default parameters appeared to generate the most reasonable binding pocket. But this assessment is based off subjective visual observation by the author, and therefore introduces further bias. One may expect applying the same algorithm with the same parameters to many PDBs may at least introduce the same bias to all samples, but the algorithm may distort some PDBs more than others depending on the shape and size of their binding pocket.